Limbach currently trades at $84.49 per share and has shown little upside over the past six months, posting a middling return of 4.5%. However, the stock is beating the S&P 500’s 11% decline during that period.
Is there a buying opportunity in Limbach, or does it present a risk to your portfolio? Get the full stock story straight from our expert analysts, it’s free.
Even with the strong relative performance, we're swiping left on Limbach for now. Here are three reasons why there are better opportunities than LMB and a stock we'd rather own.
Why Is Limbach Not Exciting?
Established in 1901, Limbach (NASDAQ: LMB) provides integrated building systems solutions, including mechanical, electrical, and plumbing services.
1. Revenue Spiraling Downwards
A company’s long-term performance is an indicator of its overall quality. Any business can put up a good quarter or two, but the best consistently grow over the long haul. Limbach struggled to consistently generate demand over the last five years as its sales dropped at a 1.3% annual rate. This was below our standards and signals it’s a lower quality business. 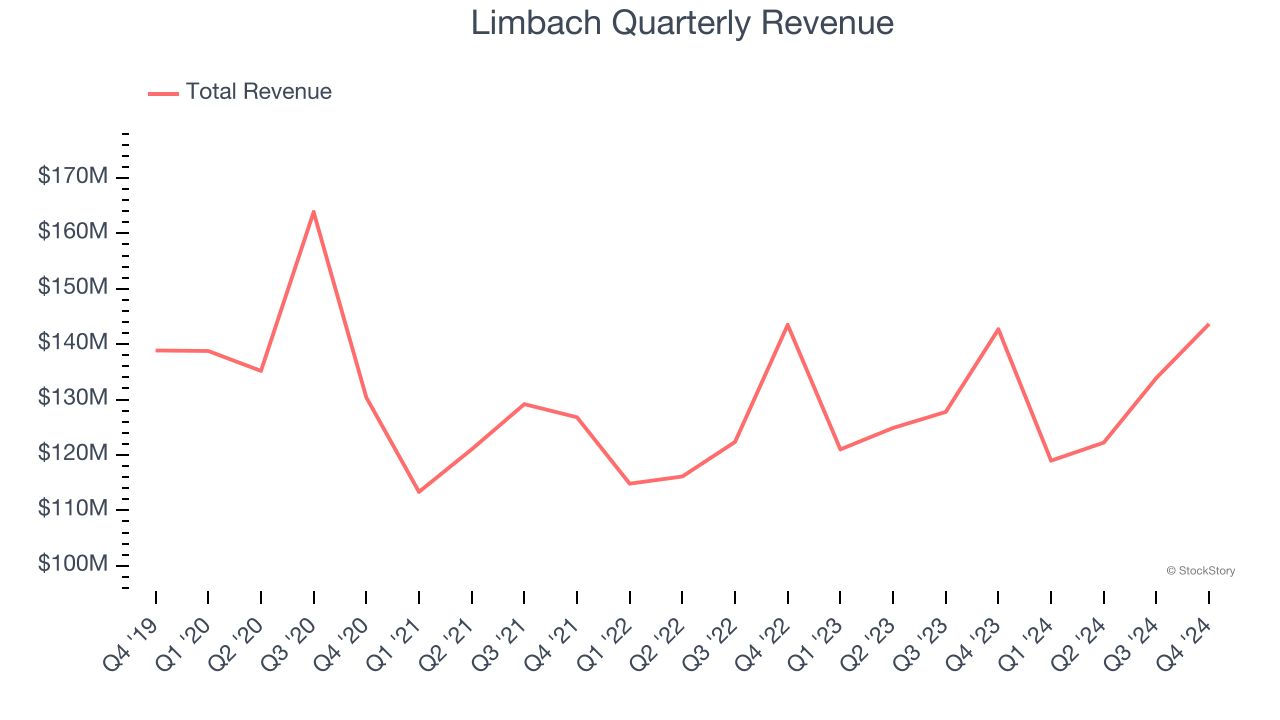
2. Low Gross Margin Reveals Weak Structural Profitability
All else equal, we prefer higher gross margins because they usually indicate that a company sells more differentiated products and commands stronger pricing power.
Limbach has bad unit economics for an industrials business, signaling it operates in a competitive market. As you can see below, it averaged a 20.3% gross margin over the last five years. Said differently, Limbach had to pay a chunky $79.75 to its suppliers for every $100 in revenue. 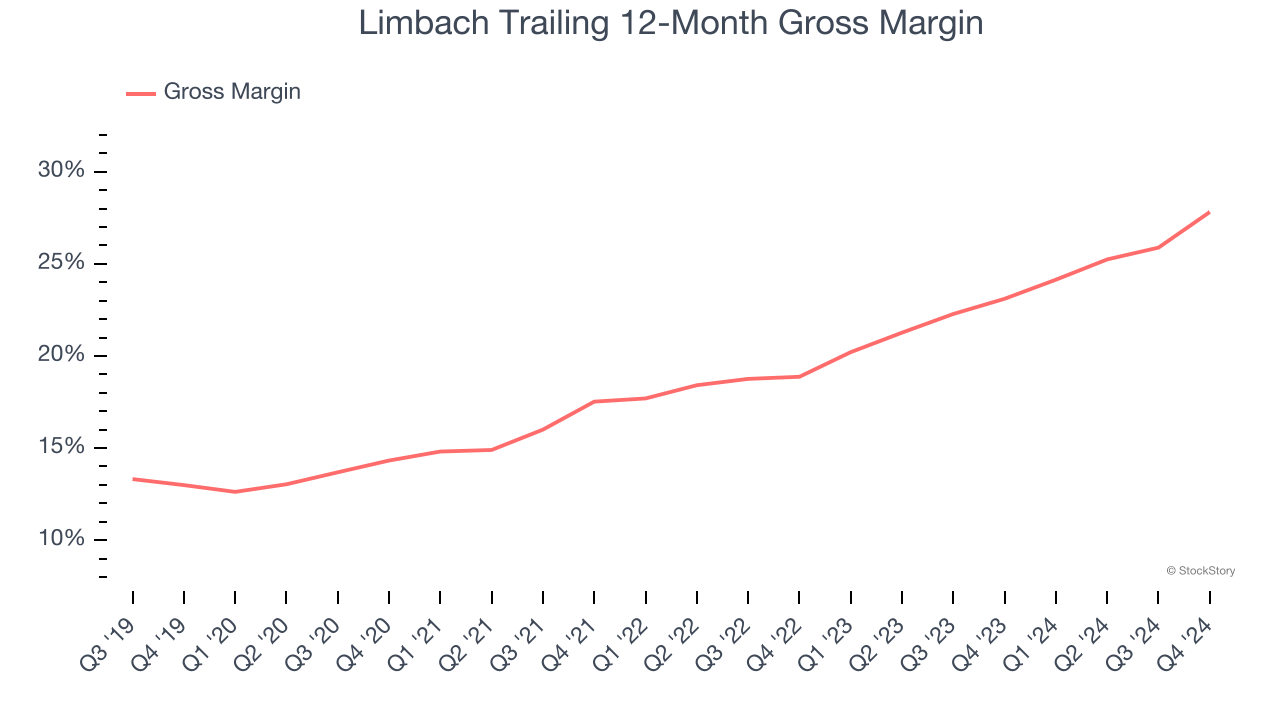
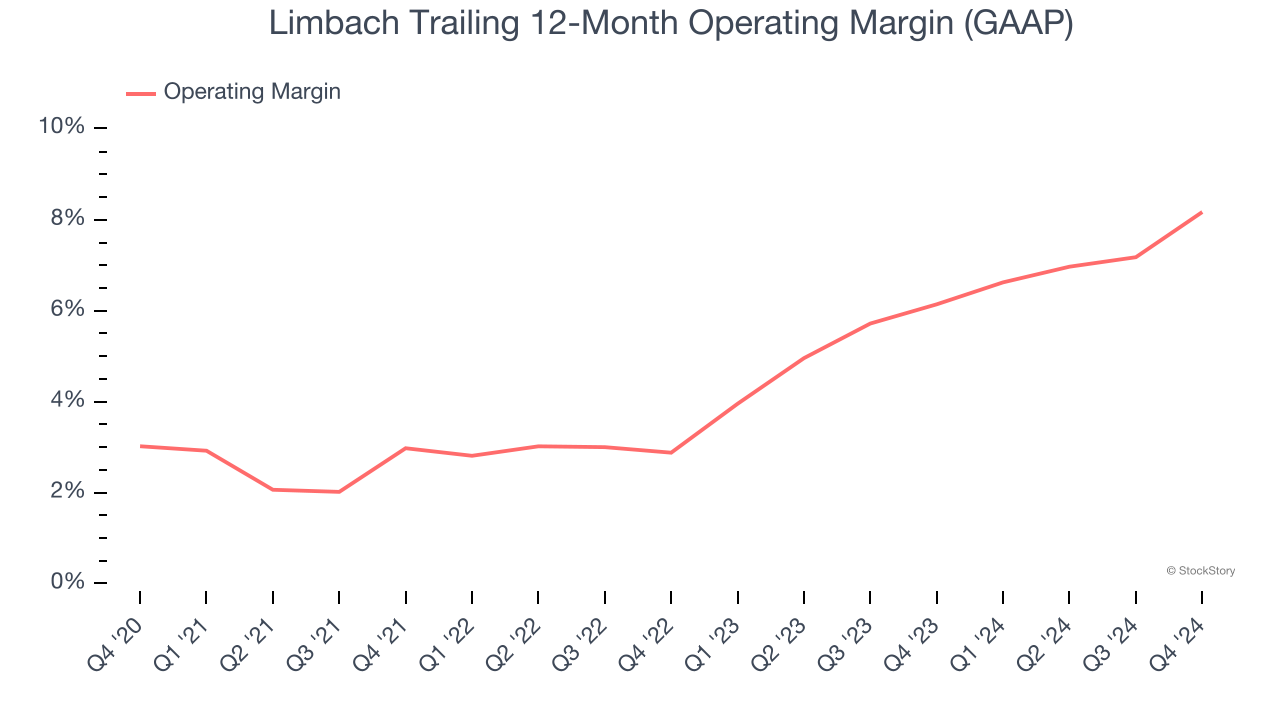
3. Weak Operating Margin Could Cause Trouble
Operating margin is one of the best measures of profitability because it tells us how much money a company takes home after procuring and manufacturing its products, marketing and selling those products, and most importantly, keeping them relevant through research and development.
Limbach was profitable over the last five years but held back by its large cost base. Its average operating margin of 4.6% was weak for an industrials business. This result isn’t too surprising given its low gross margin as a starting point.
Final Judgment
Limbach isn’t a terrible business, but it isn’t one of our picks. Following its recent outperformance in a weaker market environment, the stock trades at 26.5× forward price-to-earnings (or $84.49 per share). This multiple tells us a lot of good news is priced in - we think there are better stocks to buy right now. We’d recommend looking at the Amazon and PayPal of Latin America.
Stocks We Would Buy Instead of Limbach
Market indices reached historic highs following Donald Trump’s presidential victory in November 2024, but the outlook for 2025 is clouded by new trade policies that could impact business confidence and growth.
While this has caused many investors to adopt a "fearful" wait-and-see approach, we’re leaning into our best ideas that can grow regardless of the political or macroeconomic climate. Take advantage of Mr. Market by checking out our Top 6 Stocks for this week. This is a curated list of our High Quality stocks that have generated a market-beating return of 175% over the last five years.
Stocks that made our list in 2019 include now familiar names such as Nvidia (+2,183% between December 2019 and December 2024) as well as under-the-radar businesses like Sterling Infrastructure (+1,096% five-year return). Find your next big winner with StockStory today for free.