Brady trades at $68.82 per share and has stayed right on track with the overall market, losing 6% over the last six months while the S&P 500 is down 6.9%. This was partly driven by its softer quarterly results and might have investors contemplating their next move.
Is there a buying opportunity in Brady, or does it present a risk to your portfolio? Dive into our full research report to see our analyst team’s opinion, it’s free.
Despite the more favorable entry price, we're sitting this one out for now. Here are three reasons why we avoid BRC and a stock we'd rather own.
Why Is Brady Not Exciting?
Founded in 1914 and evolving through more than a century of industrial innovation, Brady (NYSE: BRC) manufactures and supplies identification solutions and workplace safety products that help companies identify and protect their premises, products, and people.
1. Slow Organic Growth Suggests Waning Demand In Core Business
We can better understand Safety & Security Services companies by analyzing their organic revenue. This metric gives visibility into Brady’s core business because it excludes one-time events such as mergers, acquisitions, and divestitures along with foreign currency fluctuations - non-fundamental factors that can manipulate the income statement.
Over the last two years, Brady’s organic revenue averaged 1.6% year-on-year growth. This performance was underwhelming and suggests it may need to improve its products, pricing, or go-to-market strategy, which can add an extra layer of complexity to its operations.
2. Fewer Distribution Channels Limit its Ceiling
With $1.42 billion in revenue over the past 12 months, Brady is a small player in the business services space, which sometimes brings disadvantages compared to larger competitors benefiting from economies of scale and numerous distribution channels.
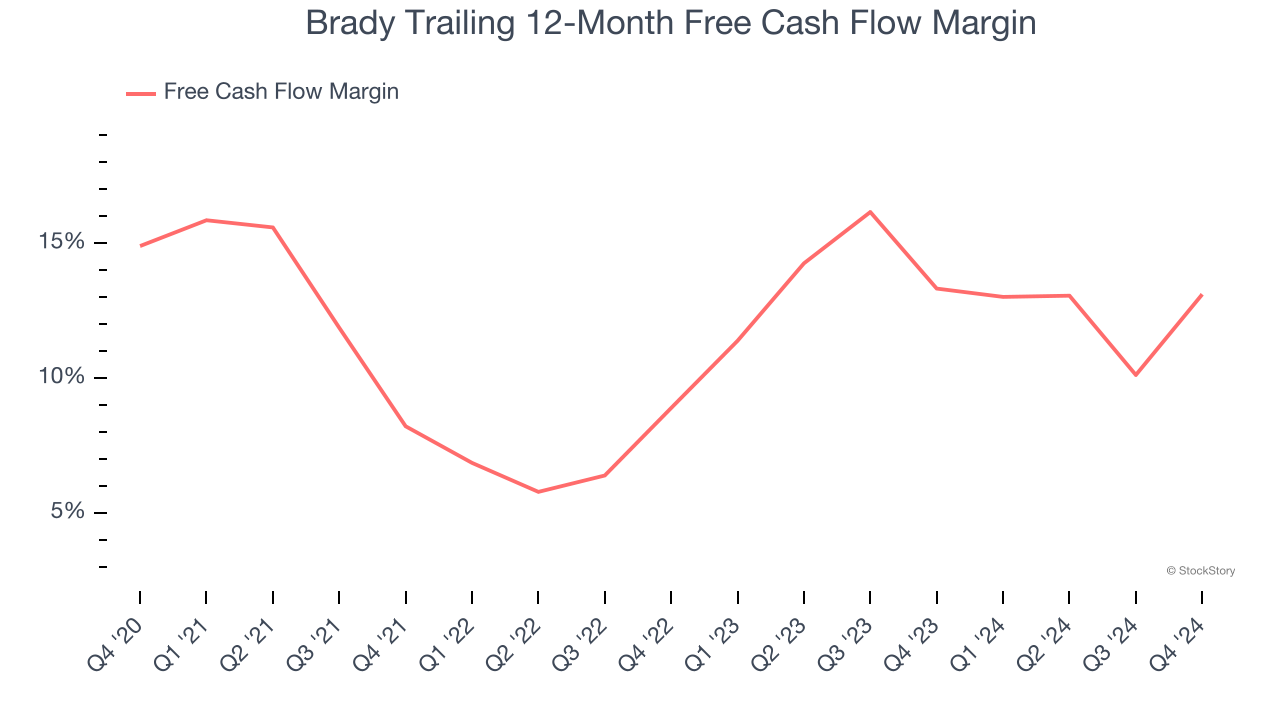
3. Free Cash Flow Margin Dropping
Free cash flow isn't a prominently featured metric in company financials and earnings releases, but we think it's telling because it accounts for all operating and capital expenses, making it tough to manipulate. Cash is king.
As you can see below, Brady’s margin dropped by 1.8 percentage points over the last five years. If its declines continue, it could signal increasing investment needs and capital intensity. Brady’s free cash flow margin for the trailing 12 months was 13.1%.
Final Judgment
Brady isn’t a terrible business, but it doesn’t pass our bar. After the recent drawdown, the stock trades at 14.1× forward price-to-earnings (or $68.82 per share). Investors with a higher risk tolerance might like the company, but we think the potential downside is too great. We're pretty confident there are more exciting stocks to buy at the moment. We’d recommend looking at the Amazon and PayPal of Latin America.
Stocks We Would Buy Instead of Brady
The market surged in 2024 and reached record highs after Donald Trump’s presidential victory in November, but questions about new economic policies are adding much uncertainty for 2025.
While the crowd speculates what might happen next, we’re homing in on the companies that can succeed regardless of the political or macroeconomic environment. Put yourself in the driver’s seat and build a durable portfolio by checking out our Top 5 Growth Stocks for this month. This is a curated list of our High Quality stocks that have generated a market-beating return of 175% over the last five years.
Stocks that made our list in 2019 include now familiar names such as Nvidia (+2,183% between December 2019 and December 2024) as well as under-the-radar businesses like Comfort Systems (+751% five-year return). Find your next big winner with StockStory today for free.


