
Electrical connector manufacturer Amphenol (NYSE: APH) reported Q1 CY2025 results topping the market’s revenue expectations, with sales up 47.7% year on year to $4.81 billion. On top of that, next quarter’s revenue guidance ($4.95 billion at the midpoint) was surprisingly good and 7.9% above what analysts were expecting. Its non-GAAP profit of $0.63 per share was 21% above analysts’ consensus estimates.
Is now the time to buy Amphenol? Find out by accessing our full research report, it’s free.
Amphenol (APH) Q1 CY2025 Highlights:
- Revenue: $4.81 billion vs analyst estimates of $4.26 billion (47.7% year-on-year growth, 13% beat)
- Adjusted EPS: $0.63 vs analyst estimates of $0.52 (21% beat)
- Adjusted EBITDA: $1.29 billion vs analyst estimates of $1.12 billion (26.8% margin, 14.5% beat)
- Revenue Guidance for Q2 CY2025 is $4.95 billion at the midpoint, above analyst estimates of $4.59 billion
- Adjusted EPS guidance for Q2 CY2025 is $0.65 at the midpoint, above analyst estimates of $0.56
- Operating Margin: 21.3%, in line with the same quarter last year
- Free Cash Flow Margin: 12%, down from 15.5% in the same quarter last year
- Market Capitalization: $79.67 billion
“We are pleased to have closed the first quarter of 2025 with record sales and Adjusted Diluted EPS, both significantly exceeding the high end of our guidance,” said Amphenol President and Chief Executive Officer, R. Adam Norwitt.
Company Overview
With over 90 years of connecting the world's technologies, Amphenol (NYSE: APH) designs and manufactures connectors, cables, sensors, and interconnect systems that enable electrical and electronic connections across virtually every industry.
Electronic Components & Manufacturing
The sector could see higher demand as the prevalence of advanced electronics increases in industries such as automotive, healthcare, aerospace, and computing. The high-performance components and contract manufacturing expertise required for autonomous vehicles and cloud computing datacenters, for instance, will benefit companies in the space. However, headwinds include geopolitical risks, particularly U.S.-China trade tensions that could disrupt component sourcing and production as the Trump administration takes an increasingly antagonizing stance on foreign relations. Additionally, stringent environmental regulations on e-waste and emissions could force the industry to pivot in potentially costly ways.
Sales Growth
Examining a company’s long-term performance can provide clues about its quality. Any business can have short-term success, but a top-tier one grows for years.
With $16.78 billion in revenue over the past 12 months, Amphenol is a behemoth in the business services sector and benefits from economies of scale, giving it an edge in distribution. This also enables it to gain more leverage on its fixed costs than smaller competitors and the flexibility to offer lower prices.
As you can see below, Amphenol’s 15.6% annualized revenue growth over the last five years was incredible. This is a great starting point for our analysis because it shows Amphenol’s demand was higher than many business services companies.
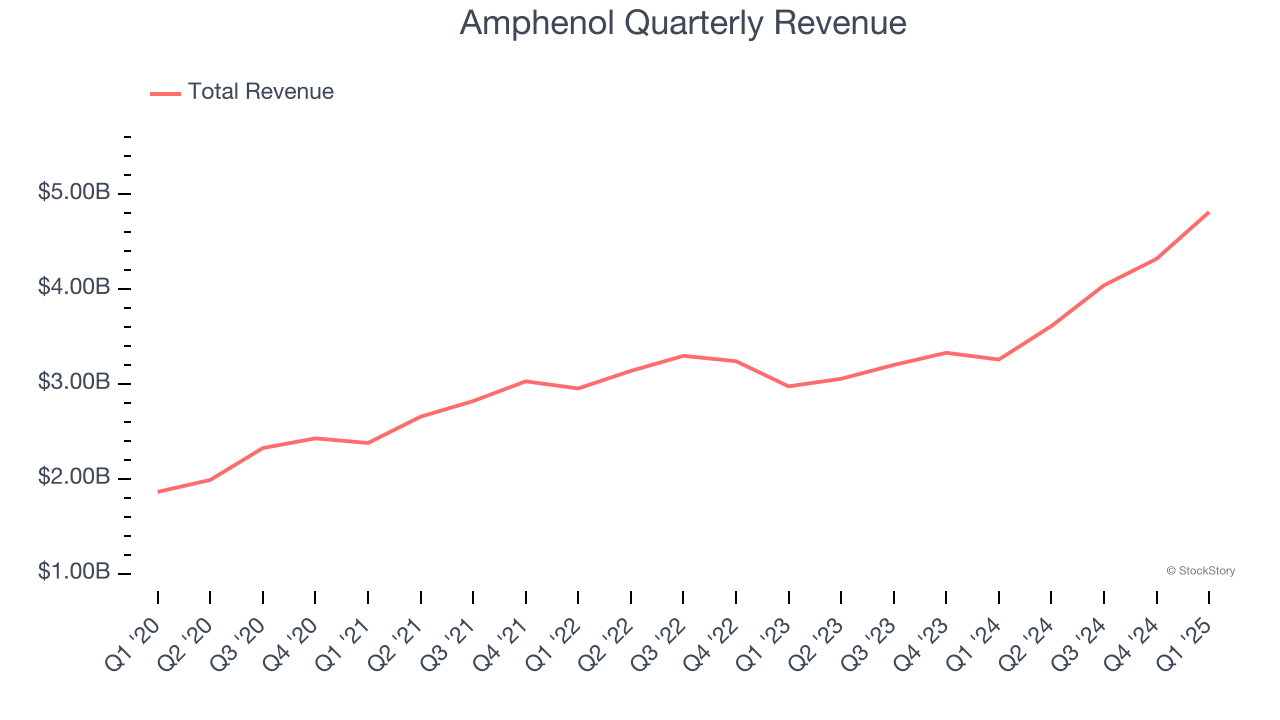
Long-term growth is the most important, but within business services, a half-decade historical view may miss new innovations or demand cycles. Amphenol’s annualized revenue growth of 15.2% over the last two years aligns with its five-year trend, suggesting its demand was predictably strong. 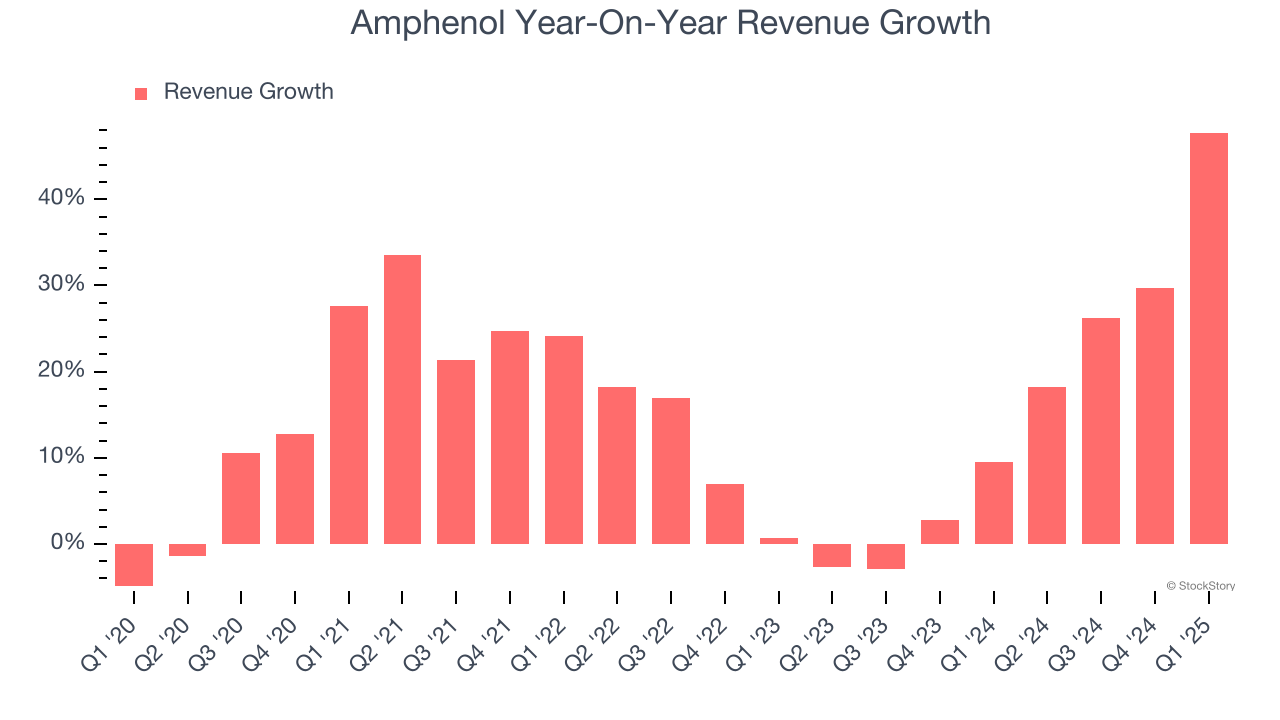
This quarter, Amphenol reported magnificent year-on-year revenue growth of 47.7%, and its $4.81 billion of revenue beat Wall Street’s estimates by 13%. Company management is currently guiding for a 37.1% year-on-year increase in sales next quarter.
Looking further ahead, sell-side analysts expect revenue to grow 13.5% over the next 12 months, a slight deceleration versus the last two years. Still, this projection is eye-popping given its scale and indicates the market is baking in success for its products and services.
Unless you’ve been living under a rock, it should be obvious by now that generative AI is going to have a huge impact on how large corporations do business. While Nvidia and AMD are trading close to all-time highs, we prefer a lesser-known (but still profitable) stock benefiting from the rise of AI. Click here to access our free report one of our favorites growth stories.
Operating Margin
Operating margin is an important measure of profitability as it shows the portion of revenue left after accounting for all core expenses – everything from the cost of goods sold to advertising and wages. It’s also useful for comparing profitability across companies with different levels of debt and tax rates because it excludes interest and taxes.
Amphenol has been a well-oiled machine over the last five years. It demonstrated elite profitability for a business services business, boasting an average operating margin of 20.3%.
Looking at the trend in its profitability, Amphenol’s operating margin rose by 1.2 percentage points over the last five years, as its sales growth gave it operating leverage.
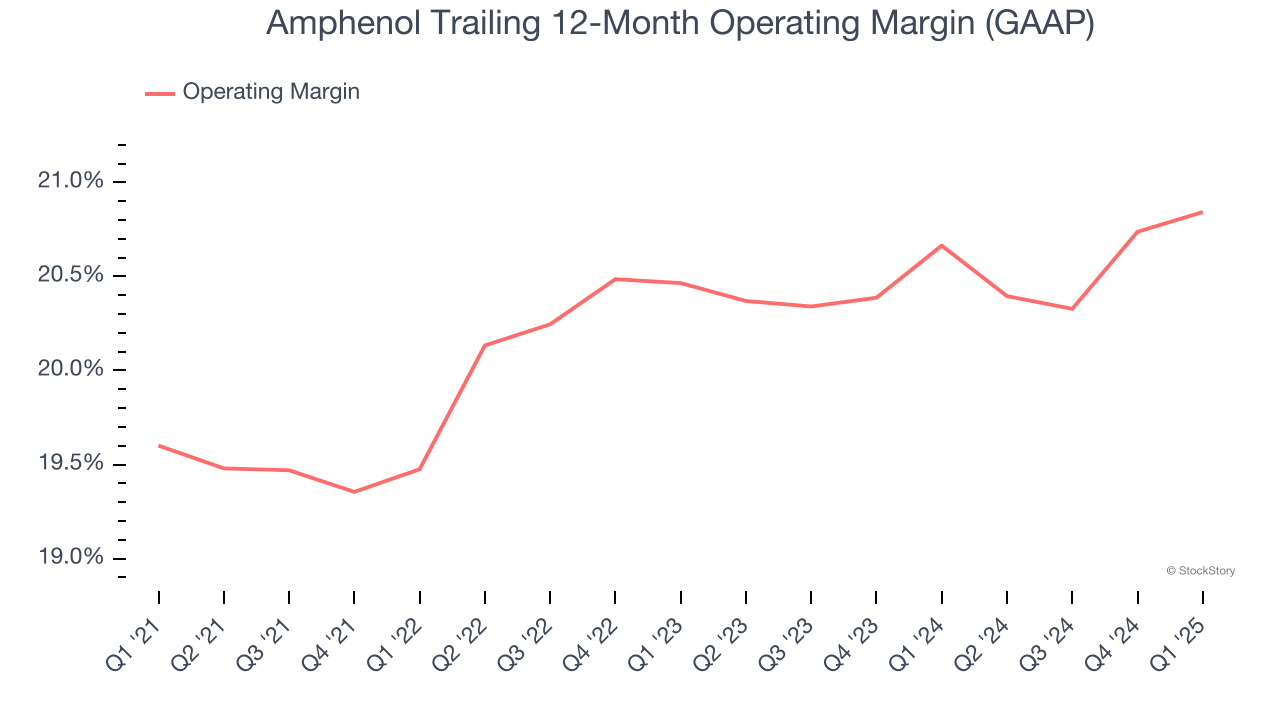
In Q1, Amphenol generated an operating profit margin of 21.3%, in line with the same quarter last year. This indicates the company’s overall cost structure has been relatively stable.
Earnings Per Share
We track the long-term change in earnings per share (EPS) for the same reason as long-term revenue growth. Compared to revenue, however, EPS highlights whether a company’s growth is profitable.
Amphenol’s EPS grew at an astounding 18.9% compounded annual growth rate over the last five years, higher than its 15.6% annualized revenue growth. This tells us the company became more profitable on a per-share basis as it expanded.
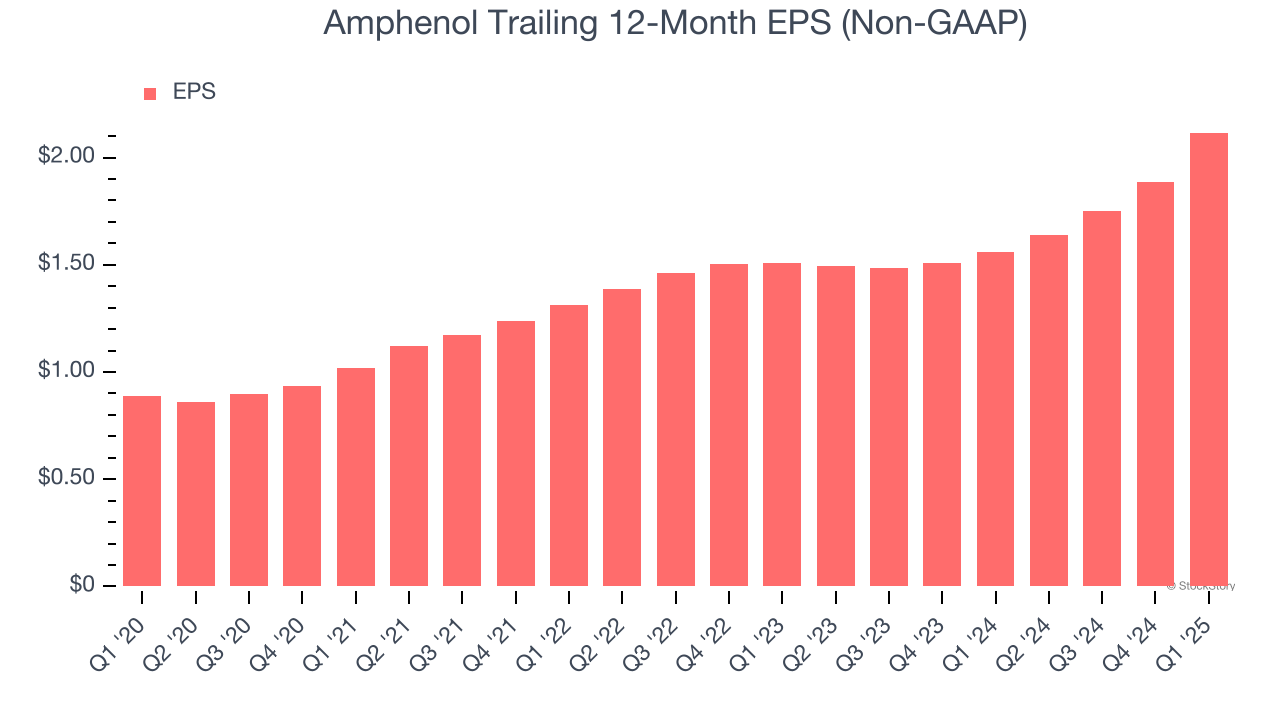
Diving into the nuances of Amphenol’s earnings can give us a better understanding of its performance. As we mentioned earlier, Amphenol’s operating margin was flat this quarter but expanded by 1.2 percentage points over the last five years. This was the most relevant factor (aside from the revenue impact) behind its higher earnings; taxes and interest expenses can also affect EPS but don’t tell us as much about a company’s fundamentals.
In Q1, Amphenol reported EPS at $0.63, up from $0.40 in the same quarter last year. This print easily cleared analysts’ estimates, and shareholders should be content with the results. Over the next 12 months, Wall Street expects Amphenol’s full-year EPS of $2.12 to grow 12.4%.
Key Takeaways from Amphenol’s Q1 Results
We were impressed by how significantly Amphenol blew past analysts’ revenue and EPS expectations this quarter. We were also excited its EPS guidance for next quarter outperformed Wall Street’s estimates by a wide margin. Zooming out, we think this quarter featured some important positives. The stock traded up 12% to $73.70 immediately after reporting.
Indeed, Amphenol had a rock-solid quarterly earnings result, but is this stock a good investment here? What happened in the latest quarter matters, but not as much as longer-term business quality and valuation, when deciding whether to invest in this stock. We cover that in our actionable full research report which you can read here, it’s free.