
Automotive retailer Lithia Motors (NYSE: LAD) missed Wall Street’s revenue expectations in Q1 CY2025, but sales rose 7.2% year on year to $9.18 billion. Its non-GAAP profit of $7.66 per share was 2.7% below analysts’ consensus estimates.
Is now the time to buy Lithia? Find out by accessing our full research report, it’s free.
Lithia (LAD) Q1 CY2025 Highlights:
- Revenue: $9.18 billion vs analyst estimates of $9.37 billion (7.2% year-on-year growth, 2.1% miss)
- Adjusted EPS: $7.66 vs analyst expectations of $7.87 (2.7% miss)
- Adjusted EBITDA: $402.1 million vs analyst estimates of $406.3 million (4.4% margin, 1% miss)
- Operating Margin: 4.4%, in line with the same quarter last year
- Free Cash Flow Margin: 2.8%, similar to the same quarter last year
- Same-Store Sales rose 2.5% year on year (-1.9% in the same quarter last year)
- Market Capitalization: $7.76 billion
"Our strong first quarter performance reflects the power of our integrated ecosystem and the disciplined execution of the Lithia & Driveway strategy by our teams," said Bryan DeBoer, President and CEO.
Company Overview
With a strong presence in the Western US, Lithia Motors (NYSE: LAD) sells a wide range of vehicles, including new and used cars, trucks, SUVs, and luxury vehicles from various manufacturers.
Vehicle Retailer
Buying a vehicle is a big decision and usually the second-largest purchase behind a home for many people, so retailers that sell new and used cars try to offer selection, convenience, and customer service to shoppers. While there is online competition, especially for research and discovery, the vehicle sales market is still very fragmented and localized given the magnitude of the purchase and the logistical costs associated with moving cars over long distances. At the end of the day, a large swath of the population relies on cars to get from point A to point B, and vehicle sellers are acutely aware of this need.
Sales Growth
Examining a company’s long-term performance can provide clues about its quality. Even a bad business can shine for one or two quarters, but a top-tier one grows for years.
With $36.85 billion in revenue over the past 12 months, Lithia is one of the larger companies in the consumer retail industry and benefits from a well-known brand that influences purchasing decisions.
As you can see below, Lithia grew its sales at an exceptional 20.5% compounded annual growth rate over the last six years (we compare to 2019 to normalize for COVID-19 impacts) as it opened new stores and expanded its reach.
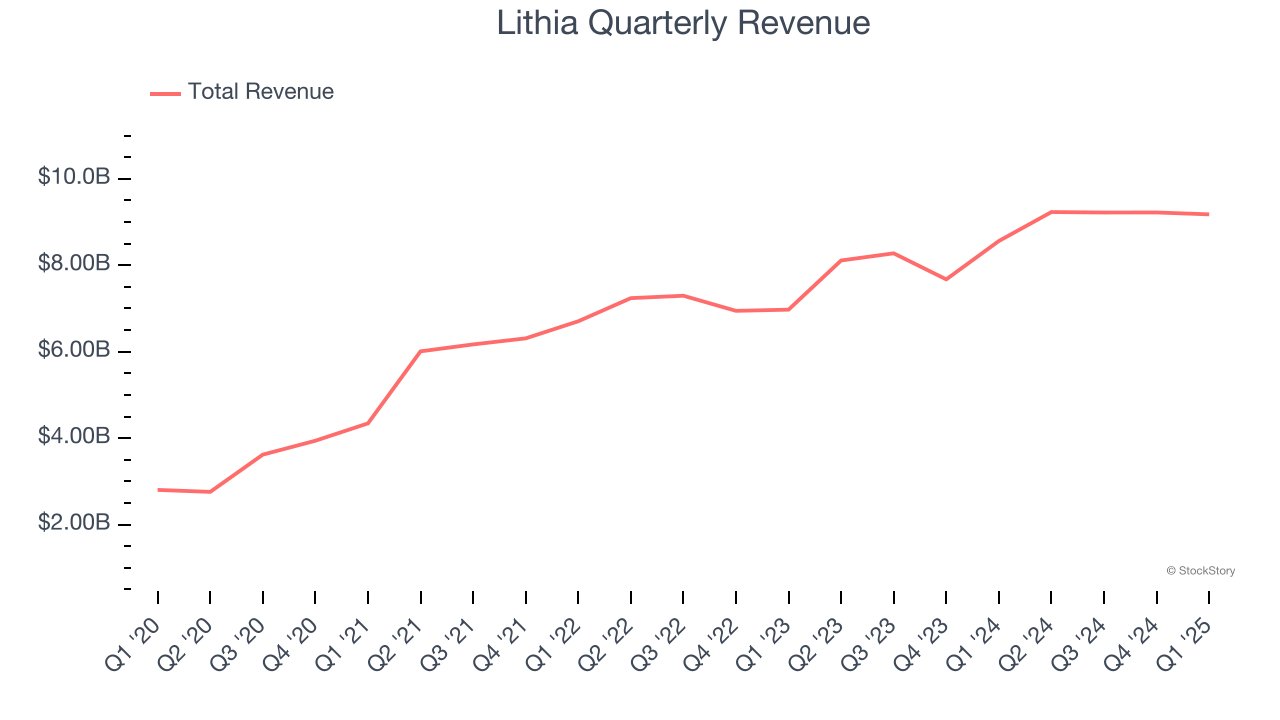
This quarter, Lithia’s revenue grew by 7.2% year on year to $9.18 billion, missing Wall Street’s estimates.
Looking ahead, sell-side analysts expect revenue to grow 6.1% over the next 12 months, a deceleration versus the last six years. We still think its growth trajectory is attractive given its scale and suggests the market is baking in success for its products.
Here at StockStory, we certainly understand the potential of thematic investing. Diverse winners from Microsoft (MSFT) to Alphabet (GOOG), Coca-Cola (KO) to Monster Beverage (MNST) could all have been identified as promising growth stories with a megatrend driving the growth. So, in that spirit, we’ve identified a relatively under-the-radar profitable growth stock benefiting from the rise of AI, available to you FREE via this link.
Store Performance
Number of Stores
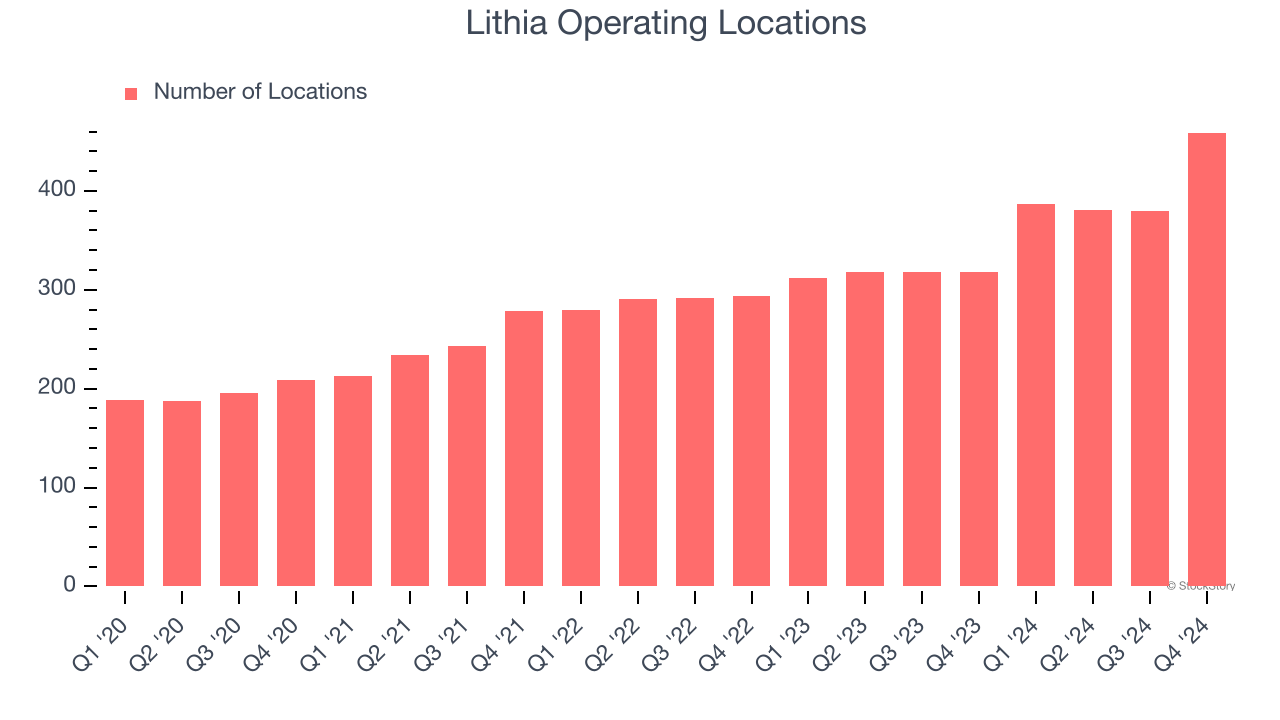
The number of stores a retailer operates is a critical driver of how quickly company-level sales can grow.
Over the last two years, Lithia opened new stores at a rapid clip by averaging 19.1% annual growth, among the fastest in the consumer retail sector.
When a retailer opens new stores, it usually means it’s investing for growth because demand is greater than supply, especially in areas where consumers may not have a store within reasonable driving distance.
Note that Lithia reports its store count intermittently, so some data points are missing in the chart below.
Same-Store Sales
The change in a company's store base only tells one side of the story. The other is the performance of its existing locations and e-commerce sales, which informs management teams whether they should expand or downsize their physical footprints. Same-store sales is an industry measure of whether revenue is growing at those existing stores and is driven by customer visits (often called traffic) and the average spending per customer (ticket).
Lithia’s demand has been shrinking over the last two years as its same-store sales have averaged 1.9% annual declines. This performance is concerning - it shows Lithia artificially boosts its revenue by building new stores. We’d like to see a company’s same-store sales rise before it takes on the costly, capital-intensive endeavor of expanding its store base.
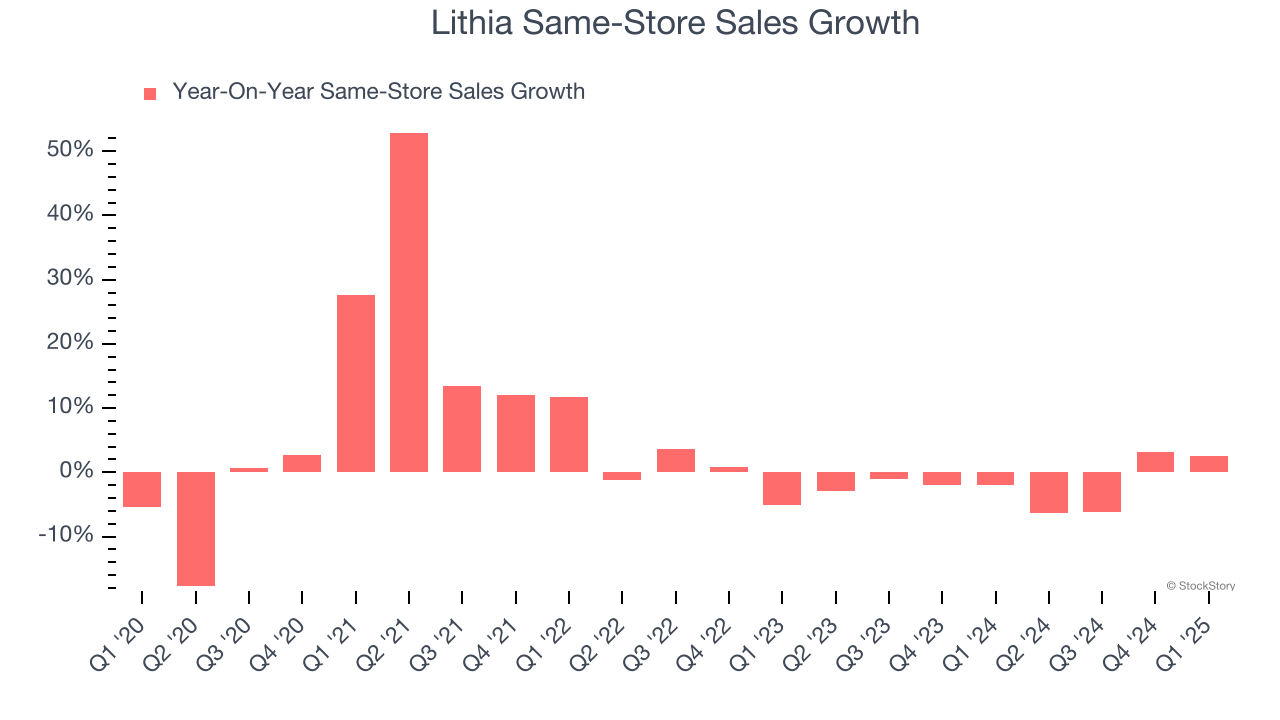
In the latest quarter, Lithia’s same-store sales rose 2.5% year on year. This growth was a well-appreciated turnaround from its historical levels, showing the business is regaining momentum.
Key Takeaways from Lithia’s Q1 Results
Lithia missed analysts’ revenue and EPS expectations. Overall, this was a softer quarter. The stock remained flat at $296.21 immediately after reporting.
The latest quarter from Lithia’s wasn’t that good. One earnings report doesn’t define a company’s quality, though, so let’s explore whether the stock is a buy at the current price. If you’re making that decision, you should consider the bigger picture of valuation, business qualities, as well as the latest earnings. We cover that in our actionable full research report which you can read here, it’s free.