
Beer company Boston Beer (NYSE: SAM) reported Q1 CY2025 results beating Wall Street’s revenue expectations, with sales up 6.5% year on year to $453.9 million. Its GAAP profit of $2.16 per share was significantly above analysts’ consensus estimates.
Is now the time to buy Boston Beer? Find out by accessing our full research report, it’s free.
Boston Beer (SAM) Q1 CY2025 Highlights:
- Revenue: $453.9 million vs analyst estimates of $433.3 million (6.5% year-on-year growth, 4.8% beat)
- EPS (GAAP): $2.16 vs analyst estimates of $0.65 (significant beat)
- Adjusted EBITDA: $62.46 million vs analyst estimates of $31.98 million (13.8% margin, 95.3% beat)
- EPS (GAAP) guidance for the full year is $9.25 at the midpoint, missing analyst estimates by 5.2%
- Operating Margin: 7.4%, up from 3.6% in the same quarter last year
- Free Cash Flow was -$7.98 million compared to -$20.62 million in the same quarter last year
- Market Capitalization: $2.72 billion
“Our business remained resilient despite subdued category trends,” said Chairman and Founder Jim Koch.
Company Overview
Known for its flavorful beverages challenging the status quo, Boston Beer (NYSE: SAM) is a pioneer in craft brewing and a symbol of American innovation in the alcoholic beverage industry.
Beverages, Alcohol, and Tobacco
These companies' performance is influenced by brand strength, marketing strategies, and shifts in consumer preferences. Changing consumption patterns are particularly relevant and can be seen in the rise of cannabis, craft beer, and vaping or the steady decline of soda and cigarettes. Companies that spend on innovation to meet consumers where they are with regards to trends can reap huge demand benefits while those who ignore trends can see stagnant volumes. Finally, with the advent of the social media, the cost of starting a brand from scratch is much lower, meaning that new entrants can chip away at the market shares of established players.
Sales Growth
Reviewing a company’s long-term sales performance reveals insights into its quality. Any business can experience short-term success, but top-performing ones enjoy sustained growth for years.
With $2.04 billion in revenue over the past 12 months, Boston Beer is a small consumer staples company, which sometimes brings disadvantages compared to larger competitors benefiting from economies of scale and negotiating leverage with retailers.
As you can see below, Boston Beer’s sales grew at a sluggish 1.7% compounded annual growth rate over the last three years. This shows it failed to generate demand in any major way and is a rough starting point for our analysis.
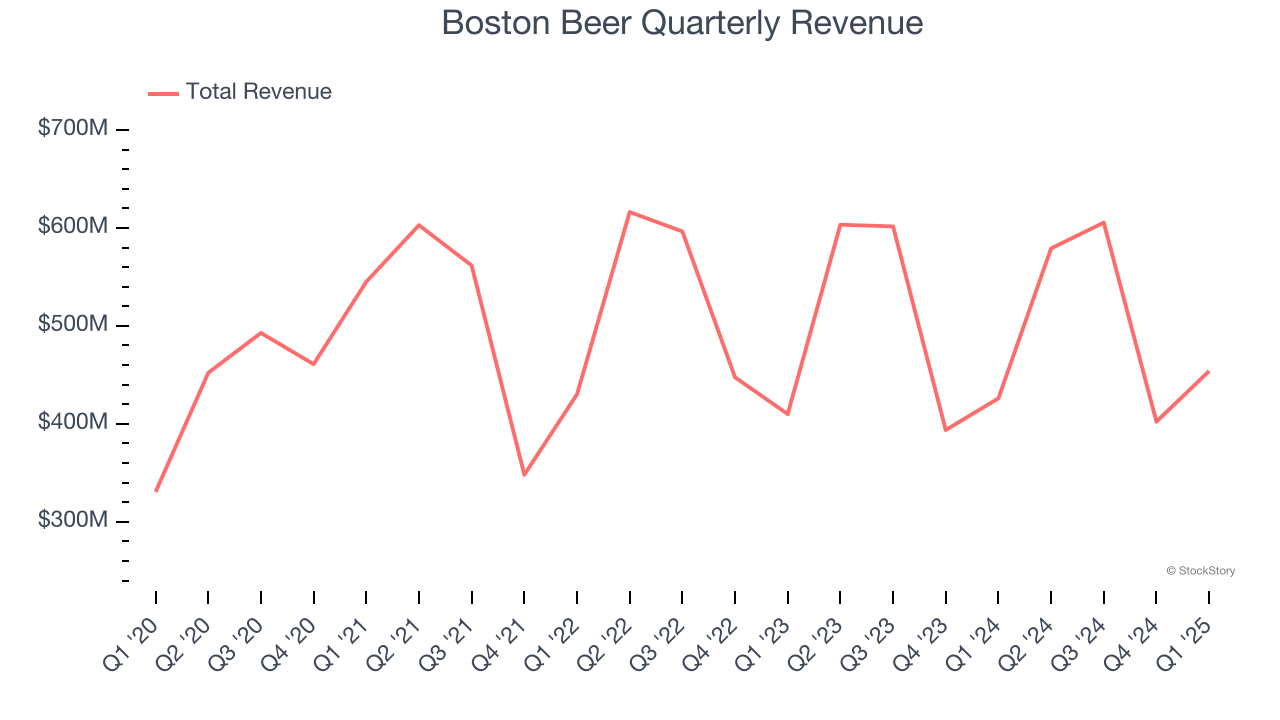
This quarter, Boston Beer reported year-on-year revenue growth of 6.5%, and its $453.9 million of revenue exceeded Wall Street’s estimates by 4.8%.
Looking ahead, sell-side analysts expect revenue to grow 1% over the next 12 months, similar to its three-year rate. This projection doesn't excite us and implies its newer products will not catalyze better top-line performance yet.
Today’s young investors won’t have read the timeless lessons in Gorilla Game: Picking Winners In High Technology because it was written more than 20 years ago when Microsoft and Apple were first establishing their supremacy. But if we apply the same principles, then enterprise software stocks leveraging their own generative AI capabilities may well be the Gorillas of the future. So, in that spirit, we are excited to present our Special Free Report on a profitable, fast-growing enterprise software stock that is already riding the automation wave and looking to catch the generative AI next.
Cash Is King
Free cash flow isn't a prominently featured metric in company financials and earnings releases, but we think it's telling because it accounts for all operating and capital expenses, making it tough to manipulate. Cash is king.
Boston Beer has shown robust cash profitability, driven by its attractive business model that enables it to reinvest or return capital to investors. The company’s free cash flow margin averaged 9.9% over the last two years, quite impressive for a consumer staples business. The divergence from its underwhelming operating margin stems from the add-back of non-cash charges like depreciation and stock-based compensation. GAAP operating profit expenses these line items, but free cash flow does not.
Taking a step back, we can see that Boston Beer’s margin dropped by 1.6 percentage points over the last year. Continued declines could signal it is in the middle of an investment cycle.
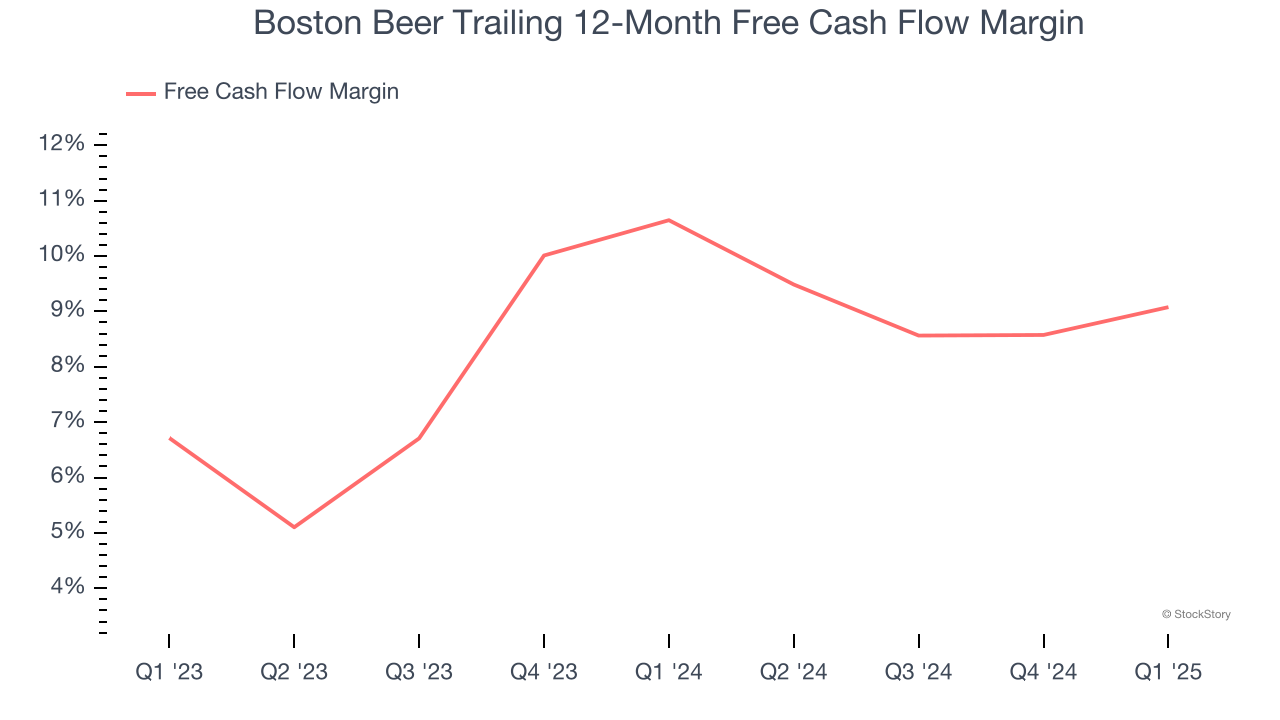
Boston Beer burned through $7.98 million of cash in Q1, equivalent to a negative 1.8% margin. The company’s cash burn was similar to its $20.62 million of lost cash in the same quarter last year. These numbers deviate from its longer-term margin, indicating it is a seasonal business that must build up inventory during certain quarters.
Key Takeaways from Boston Beer’s Q1 Results
We were impressed by how significantly Boston Beer blew past analysts’ revenue, EPS, and EBITDA expectations this quarter. On the other hand, its full-year EPS guidance missed. Still, we think this was a solid quarter with some key areas of upside. The stock traded up 2.7% to $248.65 immediately after reporting.
Boston Beer put up rock-solid earnings, but one quarter doesn’t necessarily make the stock a buy. Let’s see if this is a good investment. The latest quarter does matter, but not nearly as much as longer-term fundamentals and valuation, when deciding if the stock is a buy. We cover that in our actionable full research report which you can read here, it’s free.


