Carnival trades at $18.45 per share and has stayed right on track with the overall market, losing 11.8% over the last six months while the S&P 500 is down 8.1%. This might have investors contemplating their next move.
Is there a buying opportunity in Carnival, or does it present a risk to your portfolio? Get the full stock story straight from our expert analysts, it’s free.
Even though the stock has become cheaper, we don't have much confidence in Carnival. Here are three reasons why CCL doesn't excite us and a stock we'd rather own.
Why Do We Think Carnival Will Underperform?
Boasting outrageous amenities like a planetarium on board its ships, Carnival (NYSE: CCL) is one of the world's largest leisure travel companies and a prominent player in the cruise industry.
1. Long-Term Revenue Growth Disappoints
Examining a company’s long-term performance can provide clues about its quality. Any business can put up a good quarter or two, but many enduring ones grow for years. Over the last five years, Carnival grew its sales at a sluggish 4% compounded annual growth rate. This fell short of our benchmark for the consumer discretionary sector. 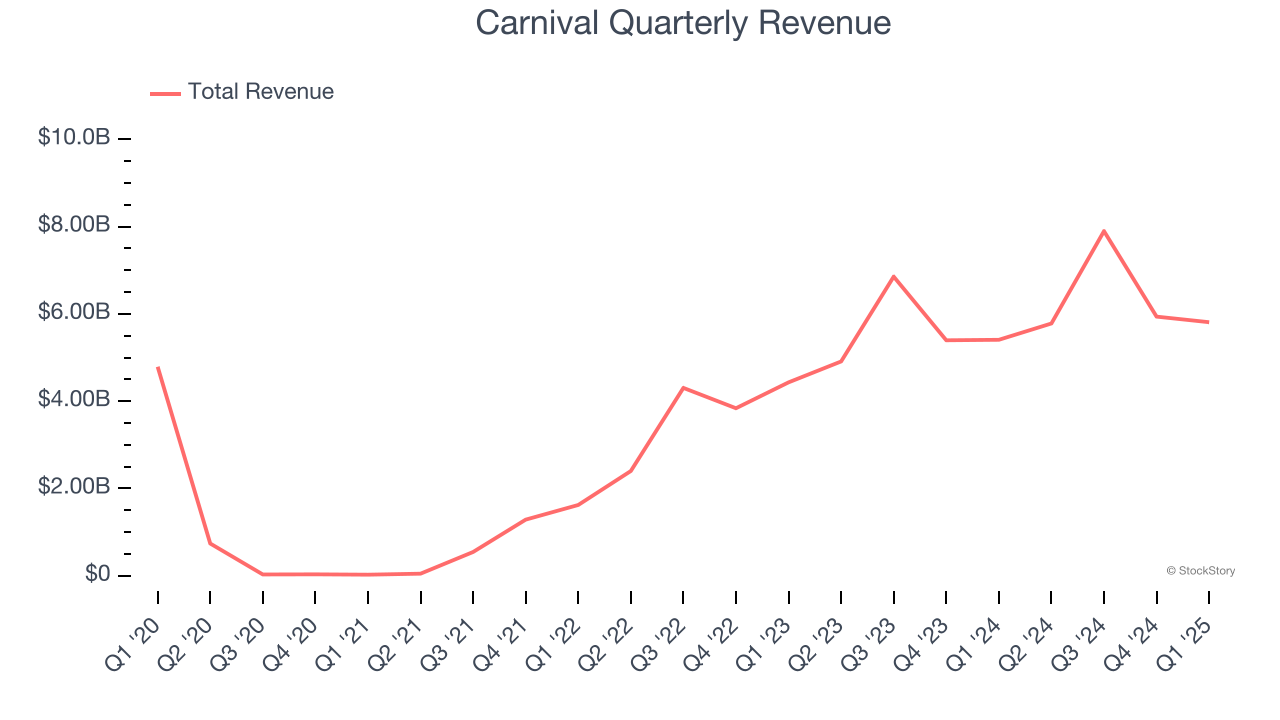
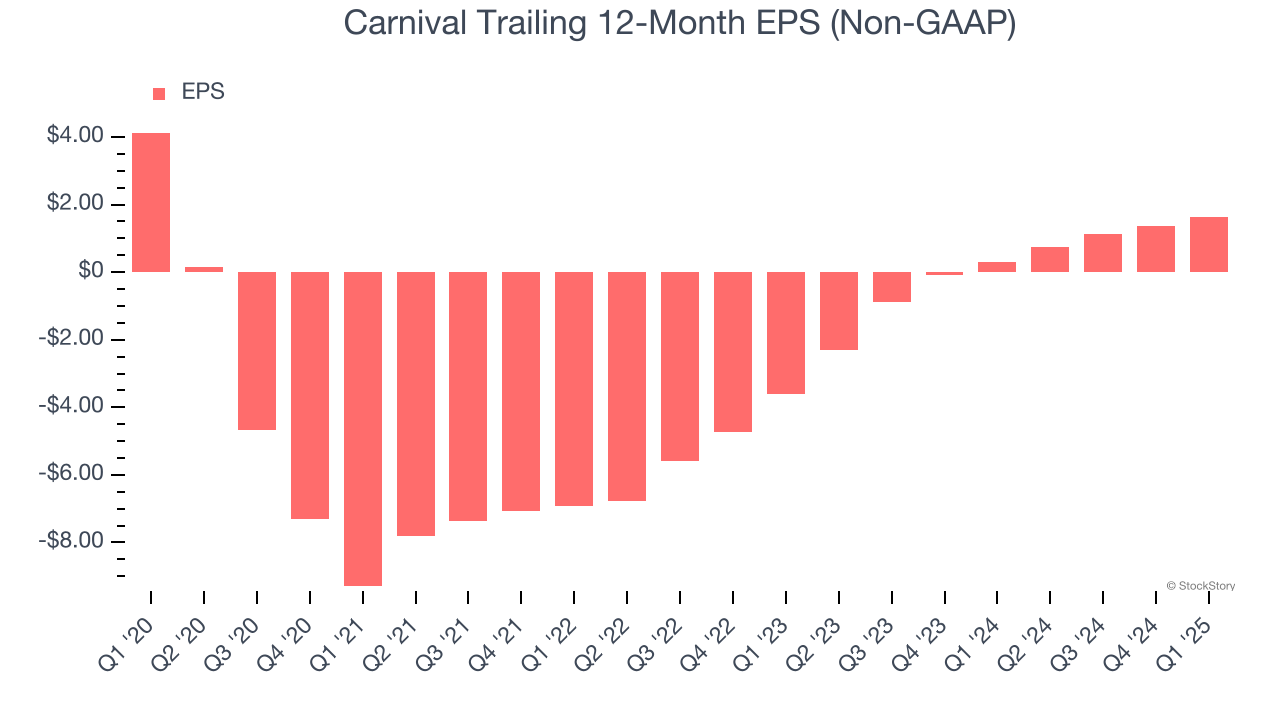
2. EPS Trending Down
We track the long-term change in earnings per share (EPS) because it highlights whether a company’s growth is profitable.
Sadly for Carnival, its EPS declined by 16.9% annually over the last five years while its revenue grew by 4%. This tells us the company became less profitable on a per-share basis as it expanded.
3. Previous Growth Initiatives Have Lost Money
Growth gives us insight into a company’s long-term potential, but how capital-efficient was that growth? A company’s ROIC explains this by showing how much operating profit it makes compared to the money it has raised (debt and equity).
Carnival’s five-year average ROIC was negative 7.8%, meaning management lost money while trying to expand the business. Its returns were among the worst in the consumer discretionary sector.
Final Judgment
Carnival doesn’t pass our quality test. Following the recent decline, the stock trades at 10.2× forward price-to-earnings (or $18.45 per share). This valuation multiple is fair, but we don’t have much confidence in the company. There are better stocks to buy right now. We’d recommend looking at the most dominant software business in the world.
Stocks We Like More Than Carnival
Donald Trump’s victory in the 2024 U.S. Presidential Election sent major indices to all-time highs, but stocks have retraced as investors debate the health of the economy and the potential impact of tariffs.
While this leaves much uncertainty around 2025, a few companies are poised for long-term gains regardless of the political or macroeconomic climate, like our Top 9 Market-Beating Stocks. This is a curated list of our High Quality stocks that have generated a market-beating return of 175% over the last five years.
Stocks that made our list in 2019 include now familiar names such as Nvidia (+2,183% between December 2019 and December 2024) as well as under-the-radar businesses like Sterling Infrastructure (+1,096% five-year return). Find your next big winner with StockStory today for free.