
Food and beverage company PepsiCo (NASDAQ: PEP) reported Q1 CY2025 results topping the market’s revenue expectations, but sales fell by 1.8% year on year to $17.92 billion. Its non-GAAP profit of $1.48 per share was 0.8% below analysts’ consensus estimates.
Is now the time to buy PepsiCo? Find out by accessing our full research report, it’s free.
PepsiCo (PEP) Q1 CY2025 Highlights:
- Revenue: $17.92 billion vs analyst estimates of $17.79 billion (1.8% year-on-year decline, 0.7% beat)
- Adjusted EPS: $1.48 vs analyst expectations of $1.49 (0.8% miss)
- Adjusted EBITDA: $3.27 billion vs analyst estimates of $3.45 billion (18.2% margin, 5.4% miss)
- Operating Margin: 14.4%, in line with the same quarter last year
- Free Cash Flow was -$1.58 billion compared to -$1.65 billion in the same quarter last year
- Organic Revenue rose 1.2% year on year (2.7% in the same quarter last year)
- Sales Volumes fell 2% year on year, in line with the same quarter last year
- Market Capitalization: $195.1 billion
Company Overview
With a history that goes back more than a century, PepsiCo (NASDAQ: PEP) is a household name in food and beverages today and best known for its flagship soda.
Beverages, Alcohol, and Tobacco
These companies' performance is influenced by brand strength, marketing strategies, and shifts in consumer preferences. Changing consumption patterns are particularly relevant and can be seen in the rise of cannabis, craft beer, and vaping or the steady decline of soda and cigarettes. Companies that spend on innovation to meet consumers where they are with regards to trends can reap huge demand benefits while those who ignore trends can see stagnant volumes. Finally, with the advent of the social media, the cost of starting a brand from scratch is much lower, meaning that new entrants can chip away at the market shares of established players.
Sales Growth
Reviewing a company’s long-term sales performance reveals insights into its quality. Any business can put up a good quarter or two, but many enduring ones grow for years.
With $91.52 billion in revenue over the past 12 months, PepsiCo is one of the most widely recognized consumer staples companies. Its influence over consumers gives it negotiating leverage with distributors, enabling it to pick and choose where it sells its products (a luxury many don’t have). However, its scale is a double-edged sword because it’s harder to find incremental growth when your existing brands have penetrated most of the market. For PepsiCo to boost its sales, it likely needs to adjust its prices, launch new offerings, or lean into foreign markets.
As you can see below, PepsiCo grew its sales at a tepid 4.2% compounded annual growth rate over the last three years as consumers bought less of its products. We’ll explore what this means in the "Volume Growth" section.
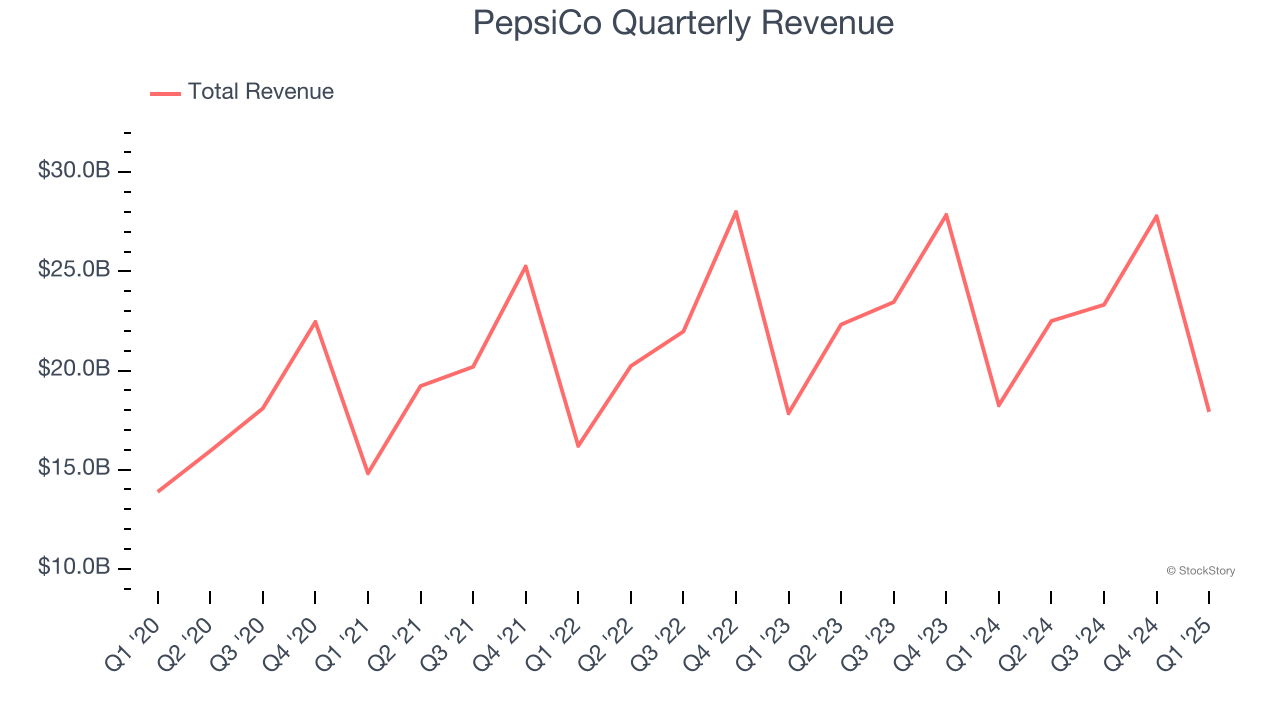
This quarter, PepsiCo’s revenue fell by 1.8% year on year to $17.92 billion but beat Wall Street’s estimates by 0.7%.
Looking ahead, sell-side analysts expect revenue to grow 1.1% over the next 12 months, a deceleration versus the last three years. This projection doesn't excite us and implies its products will face some demand challenges.
Today’s young investors won’t have read the timeless lessons in Gorilla Game: Picking Winners In High Technology because it was written more than 20 years ago when Microsoft and Apple were first establishing their supremacy. But if we apply the same principles, then enterprise software stocks leveraging their own generative AI capabilities may well be the Gorillas of the future. So, in that spirit, we are excited to present our Special Free Report on a profitable, fast-growing enterprise software stock that is already riding the automation wave and looking to catch the generative AI next.
Volume Growth
Revenue growth can be broken down into changes in price and volume (the number of units sold). While both are important, volume is the lifeblood of a successful staples business as there’s a ceiling to what consumers will pay for everyday goods; they can always trade down to non-branded products if the branded versions are too expensive.
To analyze whether PepsiCo generated its growth from changes in price or volume, we can compare its volume growth to its organic revenue growth, which excludes non-fundamental impacts on company financials like mergers and currency fluctuations.
Over the last two years, PepsiCo’s average quarterly sales volumes have shrunk by 2.4%. This decrease isn’t ideal as the quantity demanded for consumer staples products is typically stable. Luckily, PepsiCo was able to offset fewer customers purchasing its products by charging higher prices, enabling it to generate 4.4% average organic revenue growth. We hope the company can grow its volumes soon, however, as consistent price increases (on top of inflation) aren’t sustainable over the long term unless the business is really really special.
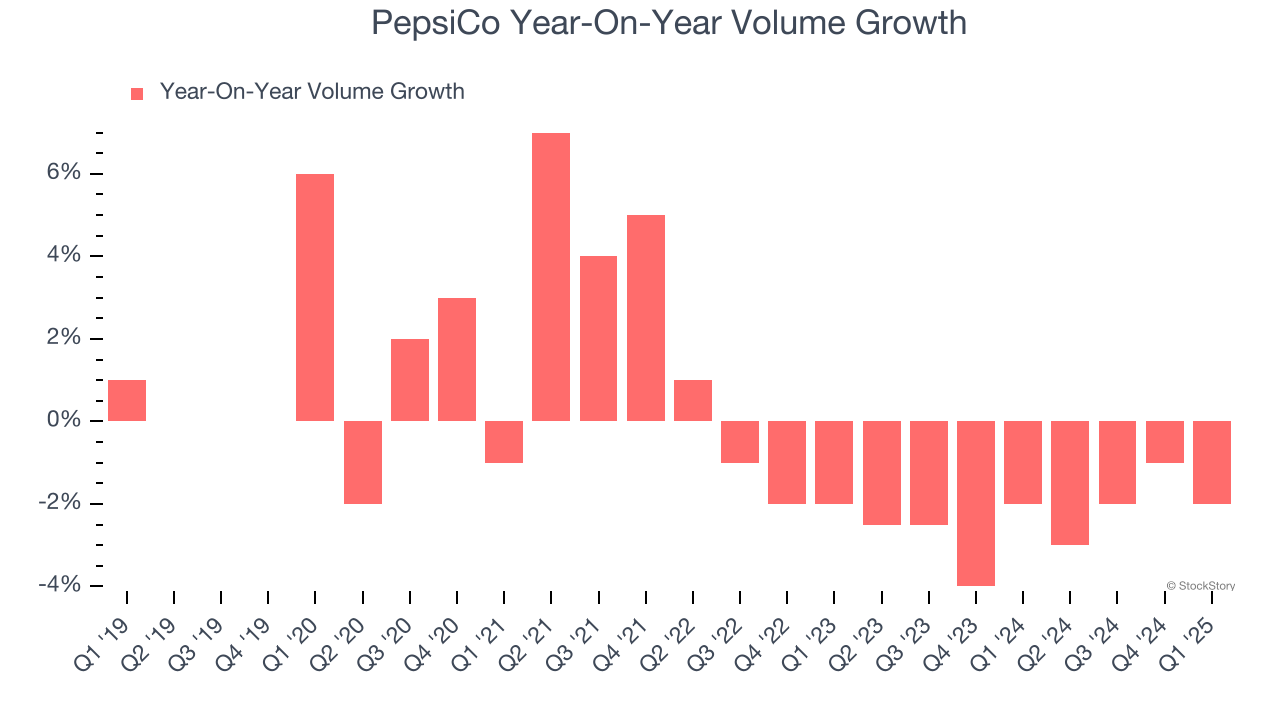
In PepsiCo’s Q1 2025, sales volumes dropped 2% year on year. This result represents a further deceleration from its historical levels, showing the business is struggling to move its products.
Key Takeaways from PepsiCo’s Q1 Results
It was encouraging to see PepsiCo beat analysts’ organic revenue expectations this quarter. On the other hand, its EPS and EBITDA missed. Overall, this was a weaker quarter. The stock remained flat at $142.30 immediately after reporting.
Should you buy the stock or not? The latest quarter does matter, but not nearly as much as longer-term fundamentals and valuation, when deciding if the stock is a buy. We cover that in our actionable full research report which you can read here, it’s free.


