
MDU Resources has gotten torched over the last six months - since October 2024, its stock price has dropped 42.8% to $16.95 per share. This was partly driven by its softer quarterly results and might have investors contemplating their next move.
Is there a buying opportunity in MDU Resources, or does it present a risk to your portfolio? Get the full stock story straight from our expert analysts, it’s free.
Even though the stock has become cheaper, we don't have much confidence in MDU Resources. Here are three reasons why you should be careful with MDU and a stock we'd rather own.
Why Do We Think MDU Resources Will Underperform?
Founded to provide electricity to towns in Minnesota, MDU Resources (NYSE: MDU) provides products and services in the utilities and construction materials industries.
1. Revenue Spiraling Downwards
Examining a company’s long-term performance can provide clues about its quality. Any business can have short-term success, but a top-tier one grows for years. MDU Resources’s demand was weak over the last five years as its sales fell at a 6.3% annual rate. This was below our standards and signals it’s a low quality business. 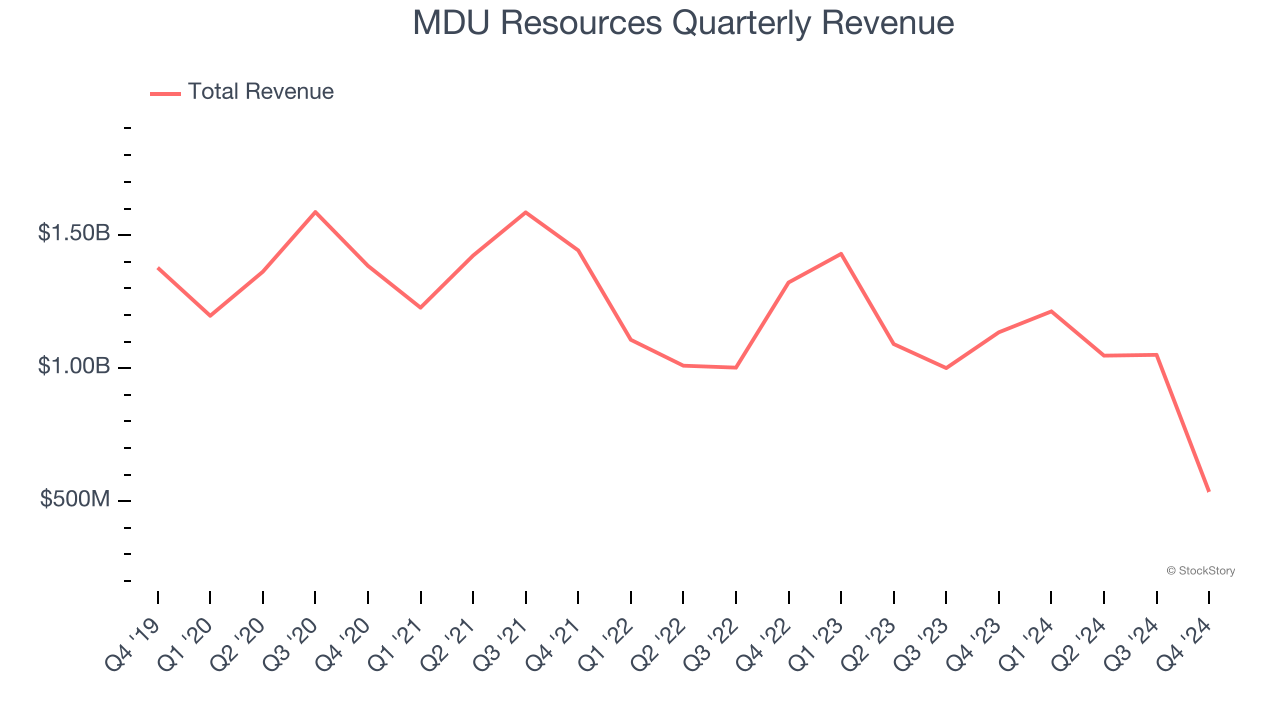
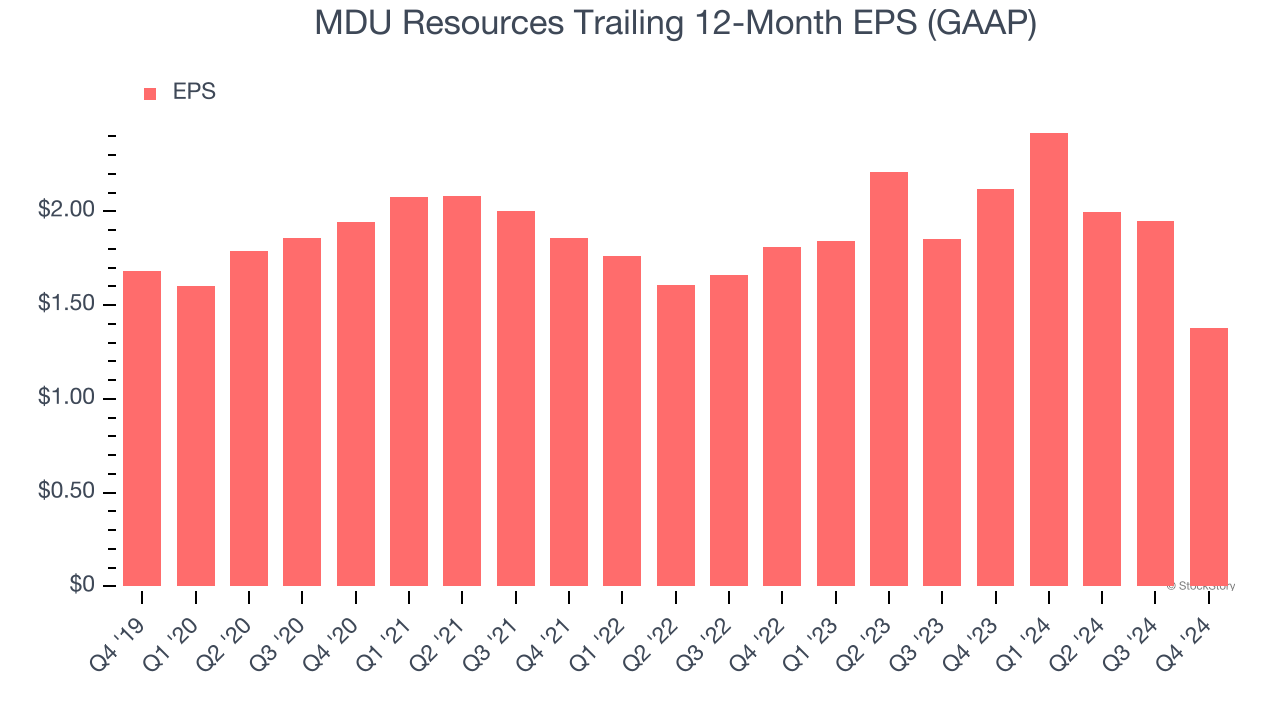
2. EPS Trending Down
Analyzing the long-term change in earnings per share (EPS) shows whether a company's incremental sales were profitable – for example, revenue could be inflated through excessive spending on advertising and promotions.
Sadly for MDU Resources, its EPS and revenue declined by 3.9% and 6.3% annually over the last five years. We tend to steer our readers away from companies with falling revenue and EPS, where diminishing earnings could imply changing secular trends and preferences. If the tide turns unexpectedly, MDU Resources’s low margin of safety could leave its stock price susceptible to large downswings.
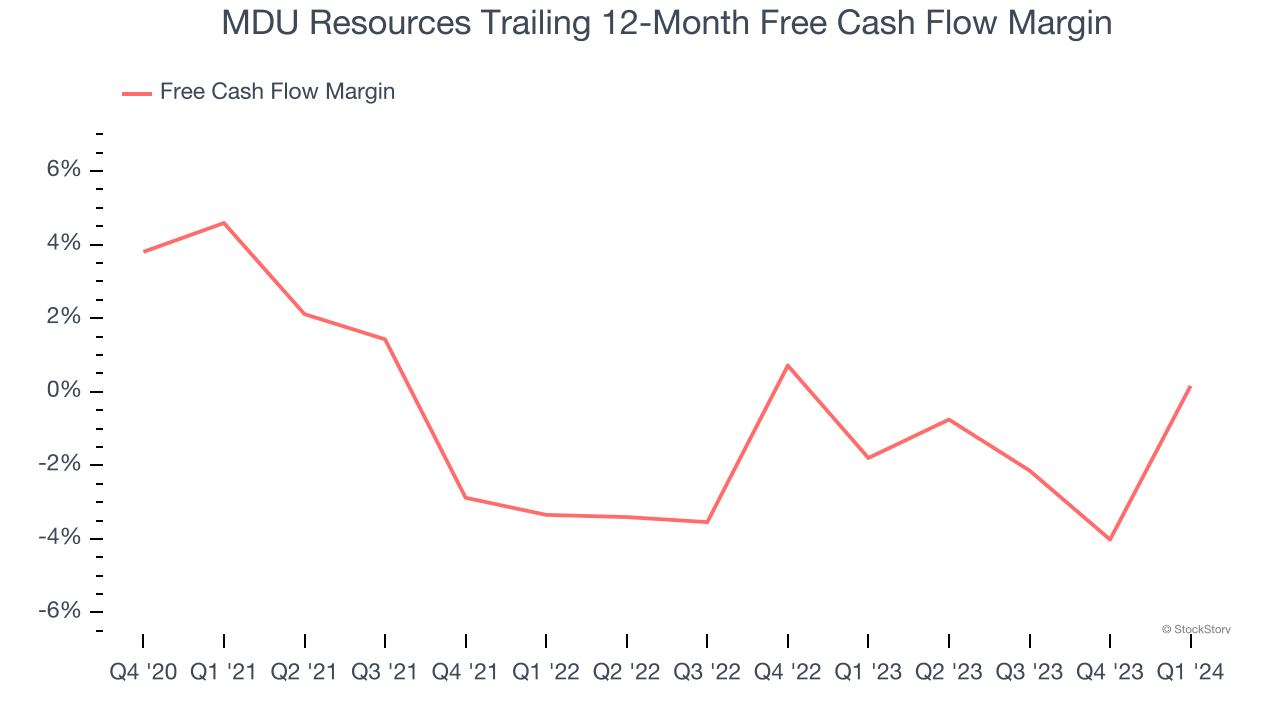
3. Breakeven Free Cash Flow Limits Reinvestment Potential
Free cash flow isn't a prominently featured metric in company financials and earnings releases, but we think it's telling because it accounts for all operating and capital expenses, making it tough to manipulate. Cash is king.
MDU Resources broke even from a free cash flow perspective over the last five years, giving the company limited opportunities to return capital to shareholders.
Final Judgment
MDU Resources falls short of our quality standards. Following the recent decline, the stock trades at 9.7× forward EV-to-EBITDA (or $16.95 per share). This valuation tells us a lot of optimism is priced in - we think there are better stocks to buy right now. Let us point you toward our favorite semiconductor picks and shovels play.
Stocks We Like More Than MDU Resources
The market surged in 2024 and reached record highs after Donald Trump’s presidential victory in November, but questions about new economic policies are adding much uncertainty for 2025.
While the crowd speculates what might happen next, we’re homing in on the companies that can succeed regardless of the political or macroeconomic environment. Put yourself in the driver’s seat and build a durable portfolio by checking out our Top 9 Market-Beating Stocks. This is a curated list of our High Quality stocks that have generated a market-beating return of 175% over the last five years.
Stocks that made our list in 2019 include now familiar names such as Nvidia (+2,183% between December 2019 and December 2024) as well as under-the-radar businesses like Sterling Infrastructure (+1,096% five-year return). Find your next big winner with StockStory today for free.