Since October 2024, Amplitude has been in a holding pattern, posting a small loss of 0.6% while floating around $8.96.
Is now the time to buy Amplitude, or should you be careful about including it in your portfolio? See what our analysts have to say in our full research report, it’s free.
We're sitting this one out for now. Here are three reasons why you should be careful with AMPL and a stock we'd rather own.
Why Is Amplitude Not Exciting?
Born out of a failed voice recognition startup by founder Spenser Skates, Amplitude (NASDAQ: AMPL) is data analytics software helping companies improve and optimize their digital products.
1. Weak Billings Point to Soft Demand
Billings is a non-GAAP metric that is often called “cash revenue” because it shows how much money the company has collected from customers in a certain period. This is different from revenue, which must be recognized in pieces over the length of a contract.
Amplitude’s billings came in at $72.9 million in Q4, and over the last four quarters, its year-on-year growth averaged 6.4%. This performance was underwhelming and suggests that increasing competition is causing challenges in acquiring/retaining customers. 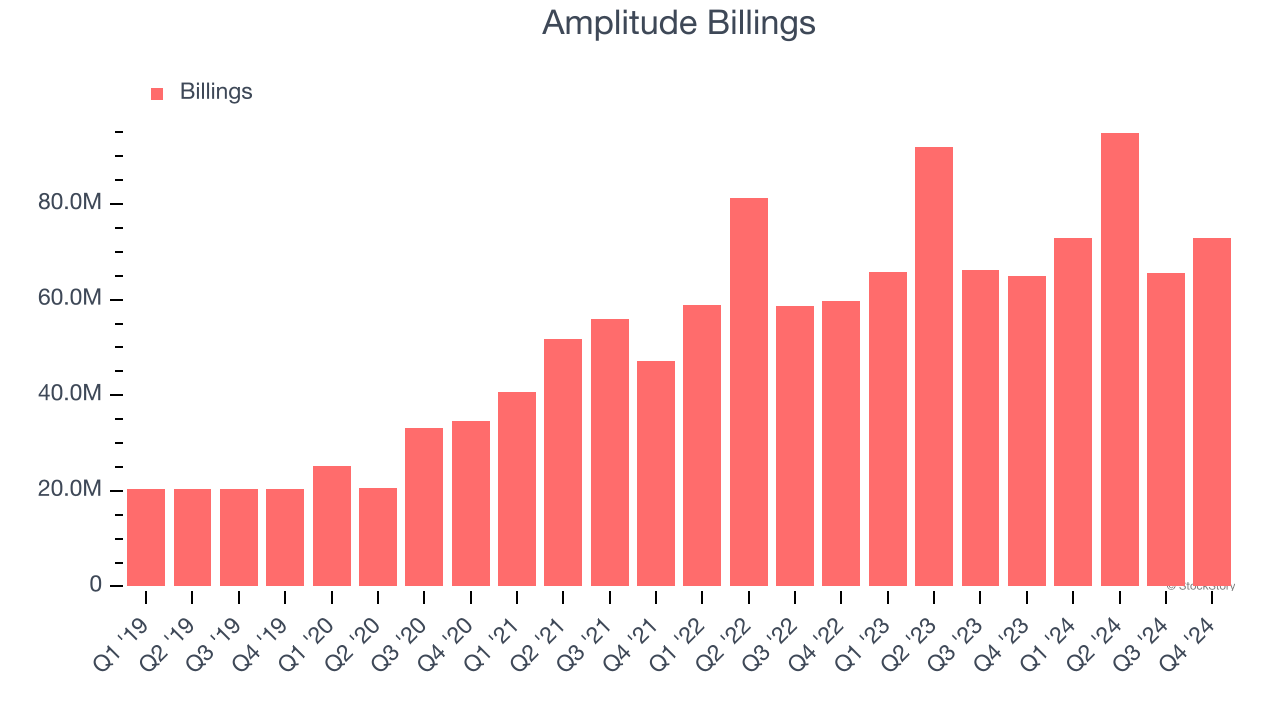
2. Customer Churn Hurts Long-Term Outlook
One of the best parts about the software-as-a-service business model (and a reason why they trade at high valuation multiples) is that customers typically spend more on a company’s products and services over time.
Amplitude’s net revenue retention rate, a key performance metric measuring how much money existing customers from a year ago are spending today, was 97.8% in Q4. This means Amplitude’s revenue would’ve decreased by 2.2% over the last 12 months if it didn’t win any new customers.
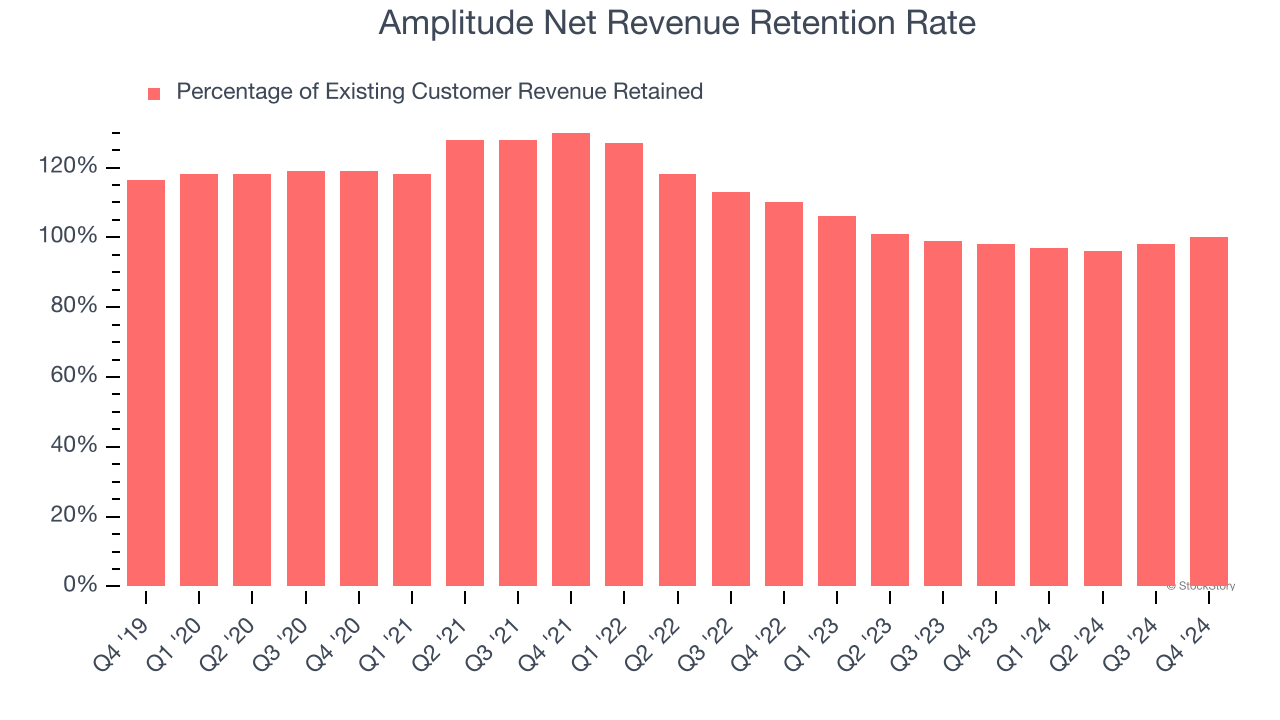
Amplitude has a weak net retention rate, signaling that some customers aren’t satisfied with its products, leading to lost contracts and revenue streams.
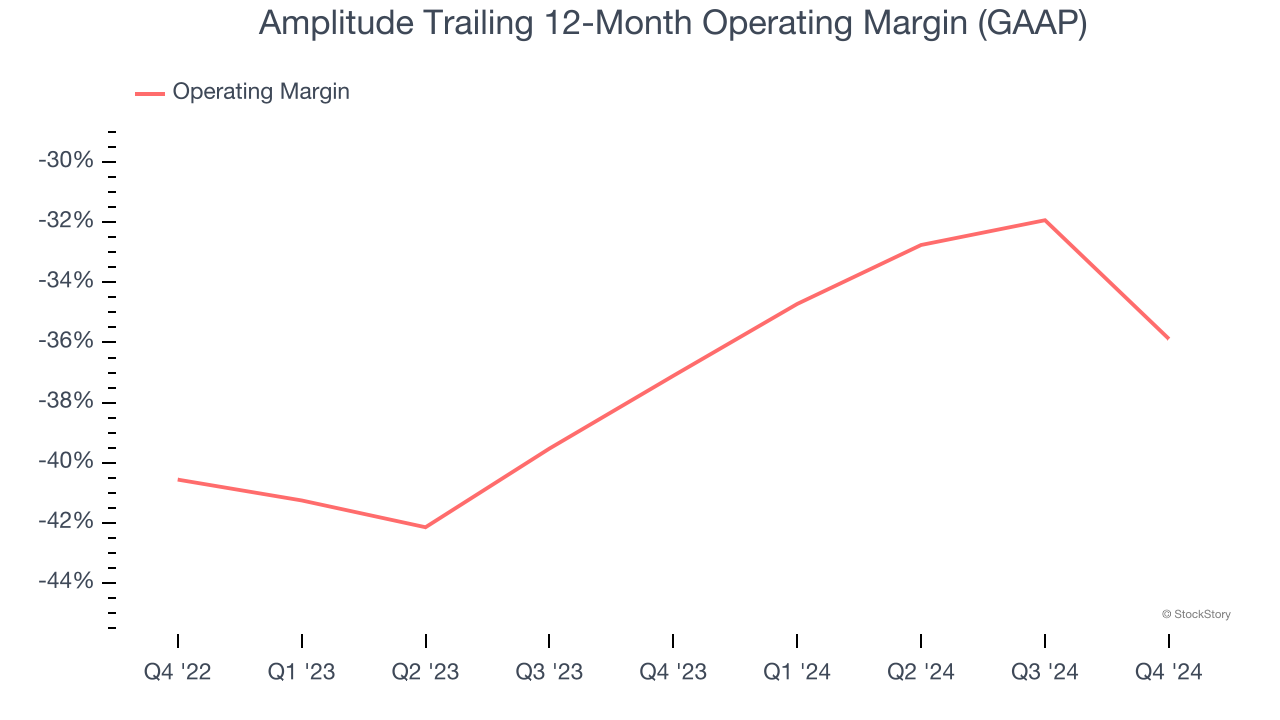
3. Operating Losses Sound the Alarms
Many software businesses adjust their profits for stock-based compensation (SBC), but we prioritize GAAP operating margin because SBC is a real expense used to attract and retain engineering and sales talent. This metric shows how much revenue remains after accounting for all core expenses – everything from the cost of goods sold to sales and R&D.
Amplitude’s expensive cost structure has contributed to an average operating margin of negative 35.9% over the last year. Unprofitable, high-growth software companies require extra attention because they spend heaps of money to capture market share. As seen in its fast historical revenue growth, this strategy seems to have worked so far, but it’s unclear what would happen if Amplitude reeled back its investments. Wall Street seems to think it will face some obstacles, and we tend to agree.
Final Judgment
Amplitude isn’t a terrible business, but it doesn’t pass our bar. That said, the stock currently trades at 3.6× forward price-to-sales (or $8.96 per share). Investors with a higher risk tolerance might like the company, but we think the potential downside is too great. We're pretty confident there are superior stocks to buy right now. Let us point you toward one of our top software and edge computing picks.
Stocks We Would Buy Instead of Amplitude
Market indices reached historic highs following Donald Trump’s presidential victory in November 2024, but the outlook for 2025 is clouded by new trade policies that could impact business confidence and growth.
While this has caused many investors to adopt a "fearful" wait-and-see approach, we’re leaning into our best ideas that can grow regardless of the political or macroeconomic climate. Take advantage of Mr. Market by checking out our Top 5 Growth Stocks for this month. This is a curated list of our High Quality stocks that have generated a market-beating return of 175% over the last five years.
Stocks that made our list in 2019 include now familiar names such as Nvidia (+2,183% between December 2019 and December 2024) as well as under-the-radar businesses like Comfort Systems (+751% five-year return). Find your next big winner with StockStory today for free.