
Network application delivery and security specialist F5 (NASDAQ: FFIV) reported Q1 CY2025 results beating Wall Street’s revenue expectations, with sales up 7.3% year on year to $731.1 million. Guidance for next quarter’s revenue was better than expected at $750 million at the midpoint, 1.6% above analysts’ estimates. Its non-GAAP profit of $3.42 per share was 10.1% above analysts’ consensus estimates.
Is now the time to buy F5? Find out by accessing our full research report, it’s free.
F5 (FFIV) Q1 CY2025 Highlights:
- Revenue: $731.1 million vs analyst estimates of $719.1 million (7.3% year-on-year growth, 1.7% beat)
- Adjusted EPS: $3.42 vs analyst estimates of $3.11 (10.1% beat)
- Adjusted Operating Income: $233.4 million vs analyst estimates of $227.6 million (31.9% margin, 2.5% beat)
- Revenue Guidance for Q2 CY2025 is $750 million at the midpoint, above analyst estimates of $737.9 million
- Adjusted EPS guidance for Q2 CY2025 is $3.47 at the midpoint, below analyst estimates of $3.56
- Operating Margin: 21.7%, up from 20.5% in the same quarter last year
- Free Cash Flow Margin: 33.7%, up from 25.4% in the previous quarter
- Billings: $707.5 million at quarter end, up 6.7% year on year
- Market Capitalization: $15.57 billion
Company Overview
Initially started as a hardware appliances company in the late 1990s, F5 (NASDAQ: FFIV) makes software that helps large enterprises ensure their web applications are always available by distributing network traffic and protecting them from cyberattacks.
Sales Growth
A company’s long-term sales performance can indicate its overall quality. Even a bad business can shine for one or two quarters, but a top-tier one grows for years. Unfortunately, F5’s 3.5% annualized revenue growth over the last three years was weak. This was below our standard for the software sector and is a rough starting point for our analysis.
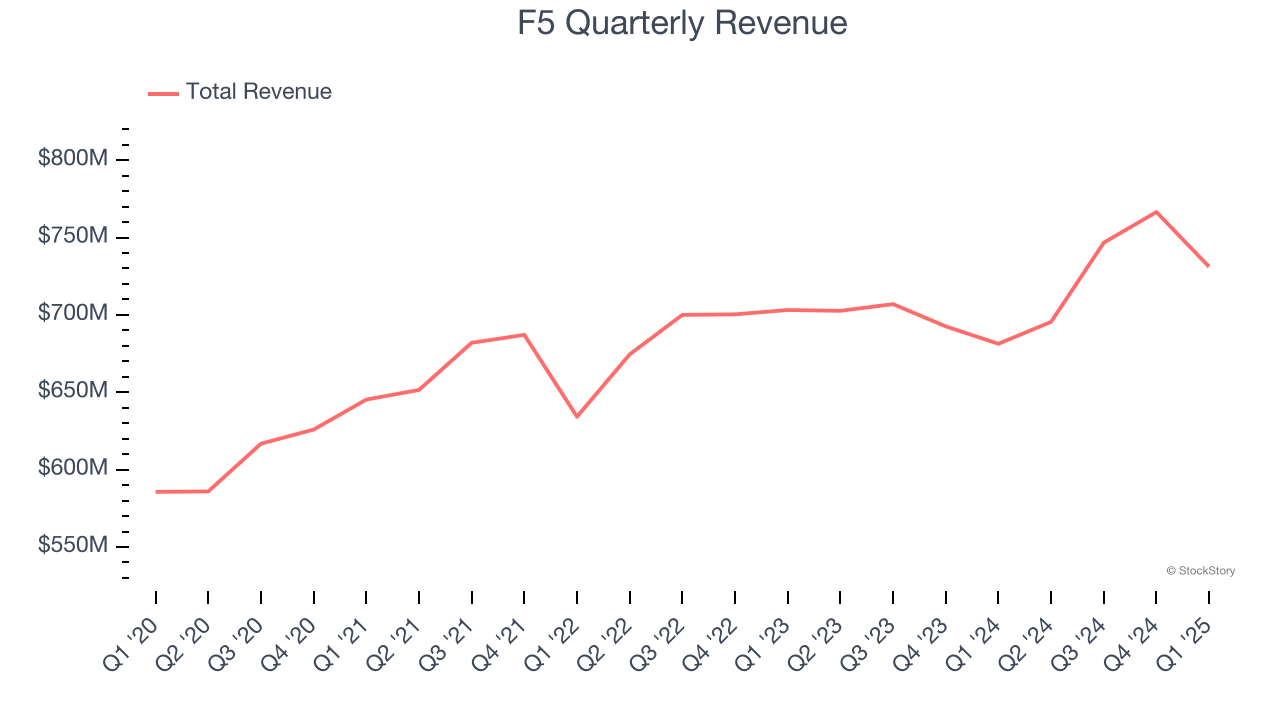
This quarter, F5 reported year-on-year revenue growth of 7.3%, and its $731.1 million of revenue exceeded Wall Street’s estimates by 1.7%. Company management is currently guiding for a 7.8% year-on-year increase in sales next quarter.
Looking further ahead, sell-side analysts expect revenue to grow 3.4% over the next 12 months, similar to its three-year rate. This projection doesn't excite us and implies its newer products and services will not catalyze better top-line performance yet.
Software is eating the world and there is virtually no industry left that has been untouched by it. That drives increasing demand for tools helping software developers do their jobs, whether it be monitoring critical cloud infrastructure, integrating audio and video functionality, or ensuring smooth content streaming. Click here to access a free report on our 3 favorite stocks to play this generational megatrend.
Billings
Billings is a non-GAAP metric that is often called “cash revenue” because it shows how much money the company has collected from customers in a certain period. This is different from revenue, which must be recognized in pieces over the length of a contract.
F5’s billings came in at $707.5 million in Q1, and over the last four quarters, its growth was underwhelming as it averaged 8.7% year-on-year increases. However, this alternate topline metric grew faster than total sales, meaning the company collects cash upfront and then recognizes the revenue over the length of its contracts - a boost for its liquidity and future revenue prospects. 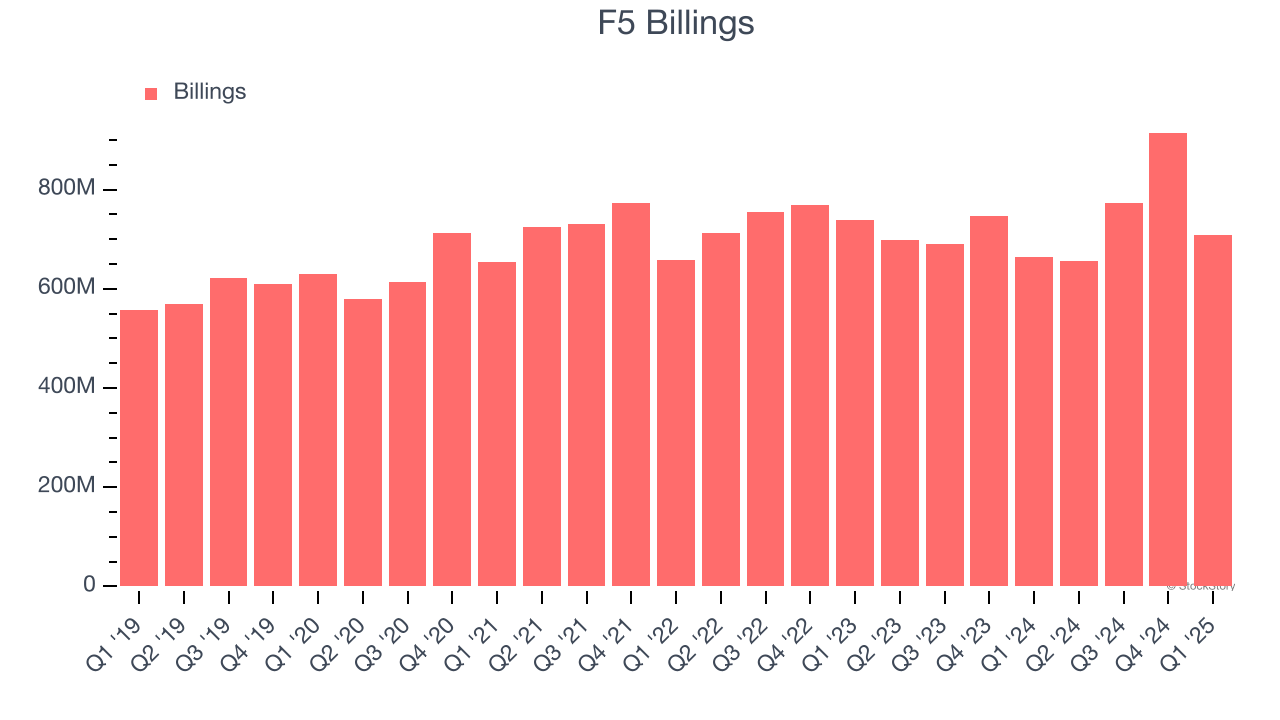
Customer Acquisition Efficiency
The customer acquisition cost (CAC) payback period represents the months required to recover the cost of acquiring a new customer. Essentially, it’s the break-even point for sales and marketing investments. A shorter CAC payback period is ideal, as it implies better returns on investment and business scalability.
F5 is very efficient at acquiring new customers, and its CAC payback period checked in at 22.3 months this quarter. The company’s rapid recovery of its customer acquisition costs means it can attempt to spur growth by increasing its sales and marketing investments.
Key Takeaways from F5’s Q1 Results
We enjoyed seeing F5 beat analysts’ billings, revenue, adjusted operating income, and EPS expectations this quarter. We were also glad its revenue guidance for next quarter exceeded Wall Street’s estimates. On the other hand, its quarterly EPS guidance missed. Zooming out, we think this was a decent quarter featuring some areas of strength. The stock traded up 1.6% to $269.29 immediately following the results.
So do we think F5 is an attractive buy at the current price? When making that decision, it’s important to consider its valuation, business qualities, as well as what has happened in the latest quarter. We cover that in our actionable full research report which you can read here, it’s free.


