Over the last six months, Jacobs Solutions shares have sunk to $123.15, producing a disappointing 13.8% loss - worse than the S&P 500’s 5% drop. This was partly due to its softer quarterly results and may have investors wondering how to approach the situation.
Is there a buying opportunity in Jacobs Solutions, or does it present a risk to your portfolio? Check out our in-depth research report to see what our analysts have to say, it’s free.
Why Do We Think Jacobs Solutions Will Underperform?
Even with the cheaper entry price, we're swiping left on Jacobs Solutions for now. Here are three reasons why there are better opportunities than J and a stock we'd rather own.
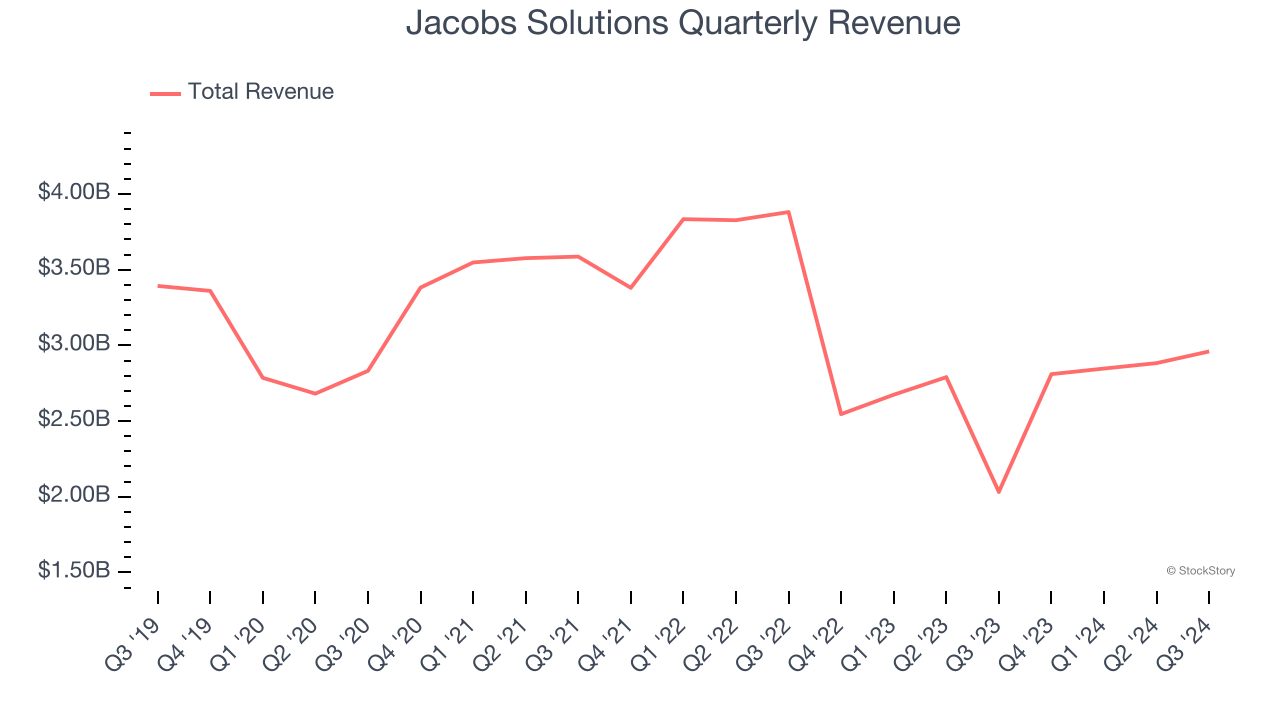
1. Revenue Spiraling Downwards
A company’s long-term sales performance can indicate its overall quality. Any business can have short-term success, but a top-tier one grows for years. Jacobs Solutions struggled to consistently generate demand over the last five years as its sales dropped at a 2% annual rate. This wasn’t a great result and signals it’s a low quality business.
2. Backlog Declines as Orders Drop
Investors interested in Government & Technical Consulting companies should track backlog in addition to reported revenue. This metric shows the value of outstanding orders that have not yet been executed or delivered, giving visibility into Jacobs Solutions’s future revenue streams.
Jacobs Solutions’s backlog came in at $21.85 billion in the latest quarter, and it averaged 13.1% year-on-year declines over the last two years. This performance was underwhelming and shows the company is not winning new orders. It also suggests there may be increasing competition or market saturation.
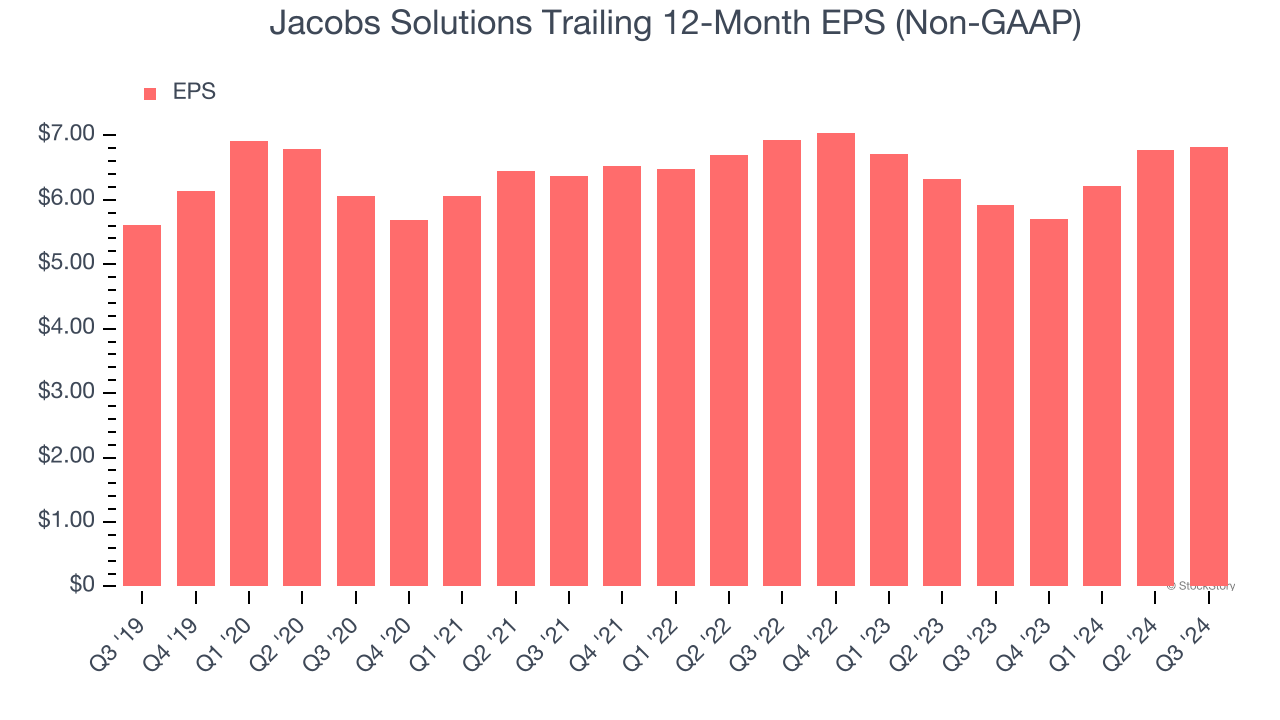
3. EPS Barely Growing
Analyzing the long-term change in earnings per share (EPS) shows whether a company's incremental sales were profitable – for example, revenue could be inflated through excessive spending on advertising and promotions.
Jacobs Solutions’s EPS grew at an unimpressive 4% compounded annual growth rate over the last five years. On the bright side, this performance was better than its 2% annualized revenue declines and tells us management adapted its cost structure in response to a challenging demand environment.
Final Judgment
Jacobs Solutions doesn’t pass our quality test. Following the recent decline, the stock trades at 20.4× forward price-to-earnings (or $123.15 per share). This multiple tells us a lot of good news is priced in - you can find better investment opportunities elsewhere. We’d recommend looking at a top digital advertising platform riding the creator economy.
Stocks We Would Buy Instead of Jacobs Solutions
Donald Trump’s victory in the 2024 U.S. Presidential Election sent major indices to all-time highs, but stocks have retraced as investors debate the health of the economy and the potential impact of tariffs.
While this leaves much uncertainty around 2025, a few companies are poised for long-term gains regardless of the political or macroeconomic climate, like our Top 9 Market-Beating Stocks. This is a curated list of our High Quality stocks that have generated a market-beating return of 175% over the last five years.
Stocks that made our list in 2019 include now familiar names such as Nvidia (+2,183% between December 2019 and December 2024) as well as under-the-radar businesses like Comfort Systems (+751% five-year return). Find your next big winner with StockStory today for free.