Hardware products and merchandising solutions provider Hillman (NASDAQ: HLMN) missed Wall Street’s revenue expectations in Q1 CY2025 as sales rose 2.6% year on year to $359.3 million. On the other hand, the company’s full-year revenue guidance of $1.54 billion at the midpoint came in 0.5% above analysts’ estimates. Its non-GAAP profit of $0.10 per share was in line with analysts’ consensus estimates.
Is now the time to buy Hillman? Find out by accessing our full research report, it’s free.
Hillman (HLMN) Q1 CY2025 Highlights:
- Revenue: $359.3 million vs analyst estimates of $361.3 million (2.6% year-on-year growth, 0.5% miss)
- Adjusted EPS: $0.10 vs analyst estimates of $0.10 (in line)
- Adjusted EBITDA: $54.53 million vs analyst estimates of $54.15 million (15.2% margin, 0.7% beat)
- The company reconfirmed its revenue guidance for the full year of $1.54 billion at the midpoint
- EBITDA guidance for the full year is $265 million at the midpoint, above analyst estimates of $261.9 million
- Operating Margin: 4.2%, in line with the same quarter last year
- Free Cash Flow was -$21.31 million compared to -$6.08 million in the same quarter last year
- Market Capitalization: $1.50 billion
"We got off to a good start during 2025, posting both top and bottom line growth which was driven by contributions from Intex DIY, which we acquired in August of 2024, and new business wins," commented Jon Michael Adinolfi, President and CEO of Hillman.
Company Overview
Established when Max Hillman purchased a franchise operation, Hillman (NASDAQ: HLMN) designs, manufactures, and sells industrial equipment and systems for various sectors.
Sales Growth
A company’s long-term sales performance can indicate its overall quality. Any business can put up a good quarter or two, but the best consistently grow over the long haul. Regrettably, Hillman’s sales grew at a sluggish 3.9% compounded annual growth rate over the last five years. This fell short of our benchmark for the industrials sector and is a tough starting point for our analysis.
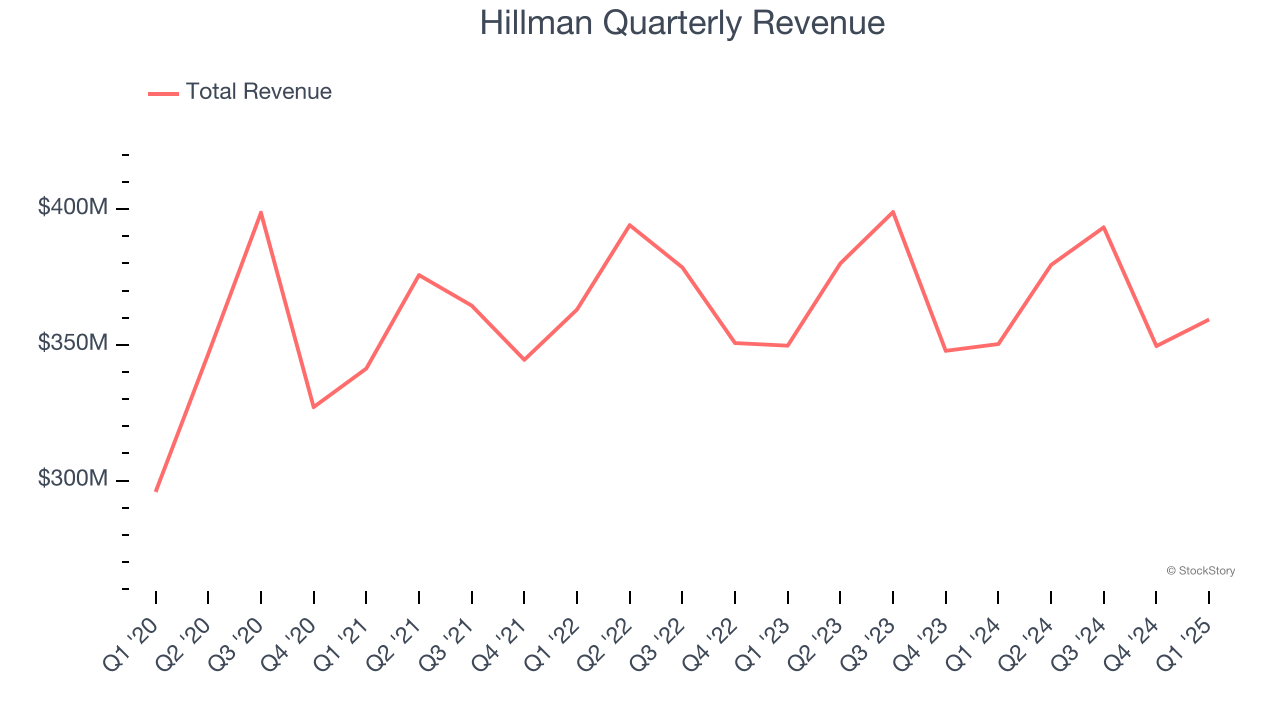
We at StockStory place the most emphasis on long-term growth, but within industrials, a half-decade historical view may miss cycles, industry trends, or a company capitalizing on catalysts such as a new contract win or a successful product line. Hillman’s recent performance shows its demand has slowed as its revenue was flat over the last two years. 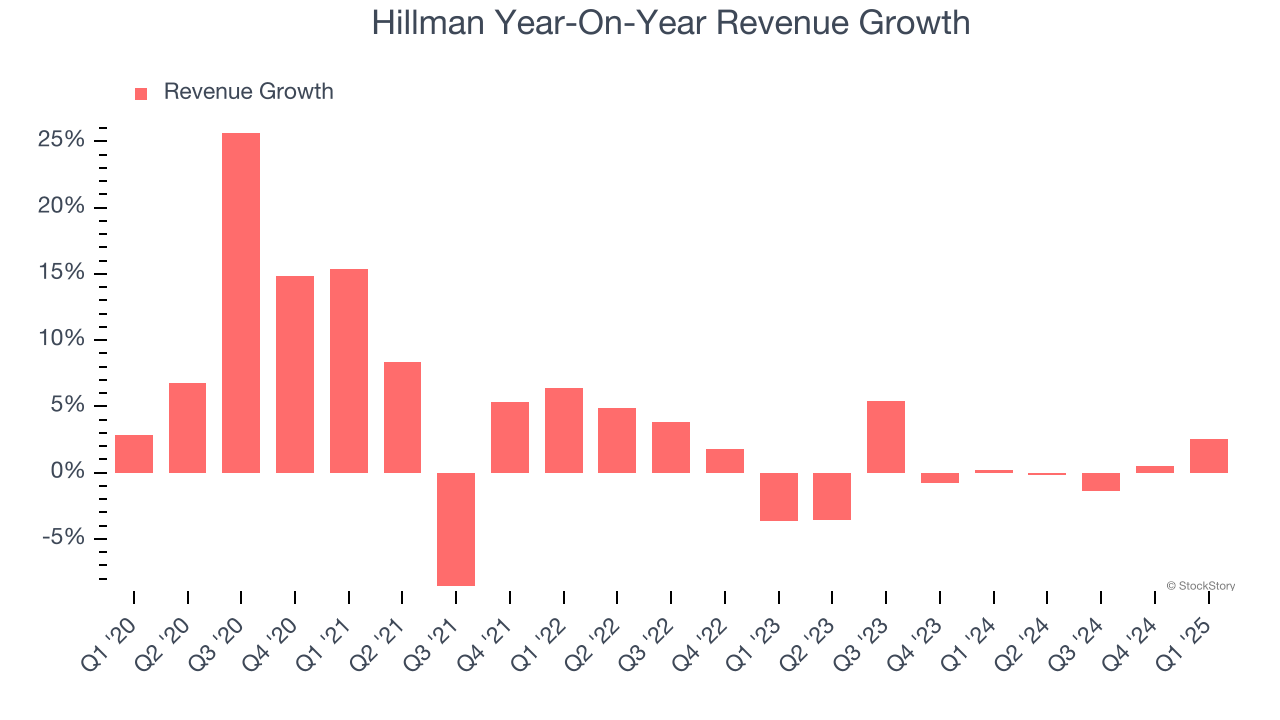
This quarter, Hillman’s revenue grew by 2.6% year on year to $359.3 million, falling short of Wall Street’s estimates.
Looking ahead, sell-side analysts expect revenue to grow 4.9% over the next 12 months. Although this projection implies its newer products and services will catalyze better top-line performance, it is still below average for the sector.
Software is eating the world and there is virtually no industry left that has been untouched by it. That drives increasing demand for tools helping software developers do their jobs, whether it be monitoring critical cloud infrastructure, integrating audio and video functionality, or ensuring smooth content streaming. Click here to access a free report on our 3 favorite stocks to play this generational megatrend.
Operating Margin
Hillman was profitable over the last five years but held back by its large cost base. Its average operating margin of 3.7% was weak for an industrials business. This result is surprising given its high gross margin as a starting point.
On the plus side, Hillman’s operating margin rose by 1.5 percentage points over the last five years, as its sales growth gave it operating leverage.
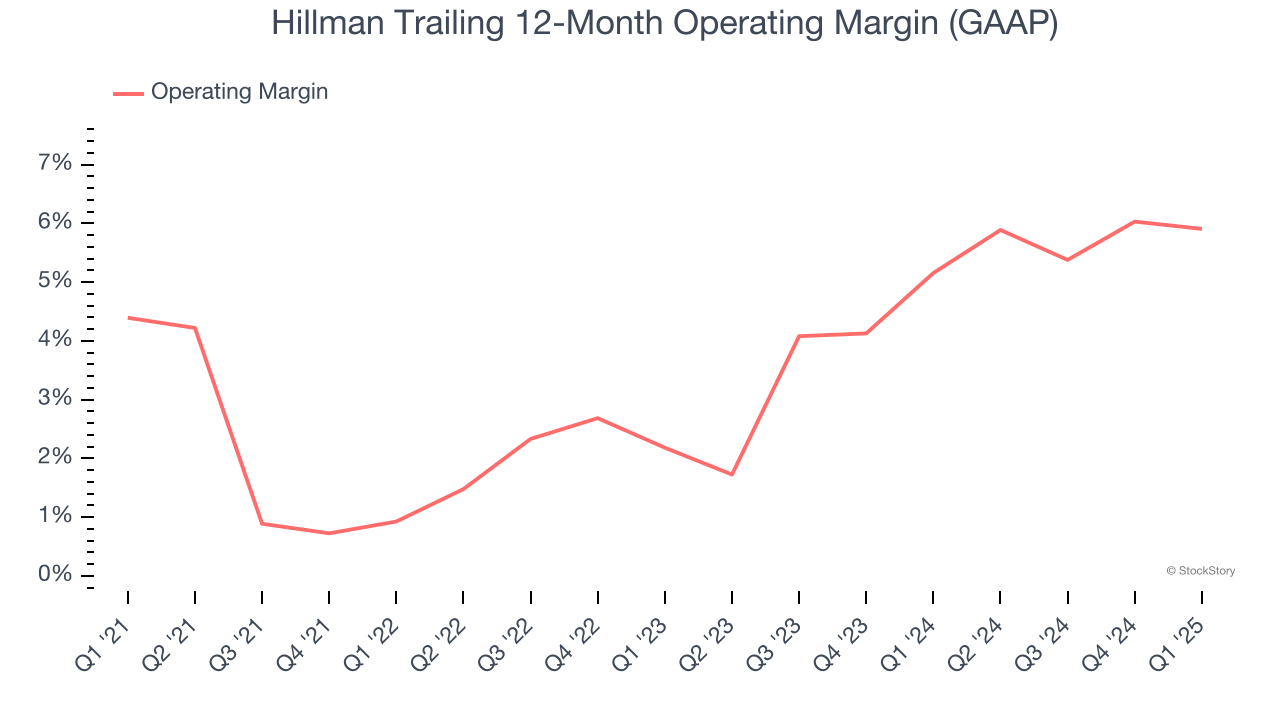
This quarter, Hillman generated an operating profit margin of 4.2%, in line with the same quarter last year. This indicates the company’s cost structure has recently been stable.
Earnings Per Share
Revenue trends explain a company’s historical growth, but the long-term change in earnings per share (EPS) points to the profitability of that growth – for example, a company could inflate its sales through excessive spending on advertising and promotions.
Hillman’s full-year EPS flipped from negative to positive over the last five years. This is encouraging and shows it’s at a critical moment in its life.
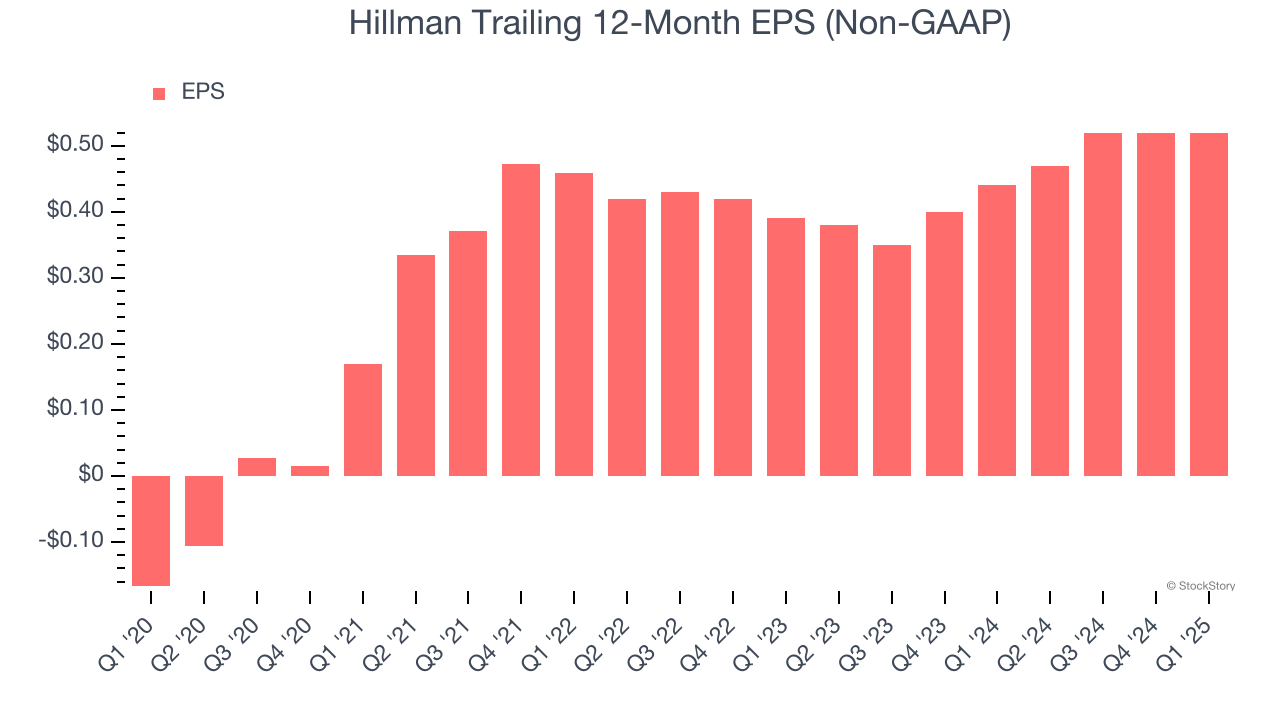
Like with revenue, we analyze EPS over a shorter period to see if we are missing a change in the business.
Hillman’s EPS grew at a spectacular 15.5% compounded annual growth rate over the last two years, higher than its flat revenue. This tells us management responded to softer demand by adapting its cost structure.
We can take a deeper look into Hillman’s earnings to better understand the drivers of its performance. While we mentioned earlier that Hillman’s operating margin was flat this quarter, a two-year view shows its margin has expanded by 3.9 percentage points. This was the most relevant factor (aside from the revenue impact) behind its higher earnings; taxes and interest expenses can also affect EPS but don’t tell us as much about a company’s fundamentals.
In Q1, Hillman reported EPS at $0.10, in line with the same quarter last year. This print beat analysts’ estimates by 3.2%. Over the next 12 months, Wall Street expects Hillman’s full-year EPS of $0.52 to grow 8.7%.
Key Takeaways from Hillman’s Q1 Results
It was good to see Hillman provide full-year revenue and EBITDA guidance that slightly beat analysts’ expectations. We were also glad its EBITDA slightly exceeded Wall Street’s estimates, though its revenue slightly missed. Still, this quarter had some key positives. The stock remained flat at $7.56 immediately after reporting.
Big picture, is Hillman a buy here and now? What happened in the latest quarter matters, but not as much as longer-term business quality and valuation, when deciding whether to invest in this stock. We cover that in our actionable full research report which you can read here, it’s free.