Biopharmaceutical company Incyte Corporation (NASDAQ: INCY) reported Q1 CY2025 results exceeding the market’s revenue expectations, with sales up 19.5% year on year to $1.05 billion. Its non-GAAP profit of $1.16 per share was 10.6% above analysts’ consensus estimates.
Is now the time to buy Incyte? Find out by accessing our full research report, it’s free.
Incyte (INCY) Q1 CY2025 Highlights:
- Revenue: $1.05 billion vs analyst estimates of $988.8 million (19.5% year-on-year growth, 6.5% beat)
- Adjusted EPS: $1.16 vs analyst estimates of $1.05 (10.6% beat)
- "The double-digit revenue growth in the first quarter driven by the continued growth of Jakafi and Opzelura and the recent launch of Niktimvo, puts us on track to achieve our full year objectives"
- Operating Margin: 19.5%, up from 10.4% in the same quarter last year
- Market Capitalization: $11.52 billion
"The double-digit revenue growth in the first quarter driven by the continued growth of Jakafi and Opzelura and the recent launch of Niktimvo, puts us on track to achieve our full year objectives," said Hervé Hoppenot, Chief Executive Officer, Incyte.
Company Overview
Founded in 1991 and evolving from a genomics research firm to a commercial-stage drug developer, Incyte (NASDAQ: INCY) is a biopharmaceutical company that discovers, develops, and commercializes proprietary therapeutics for cancer and inflammatory diseases.
Sales Growth
A company’s long-term sales performance can indicate its overall quality. Any business can experience short-term success, but top-performing ones enjoy sustained growth for years. Luckily, Incyte’s sales grew at a solid 14.6% compounded annual growth rate over the last five years. Its growth beat the average healthcare company and shows its offerings resonate with customers.
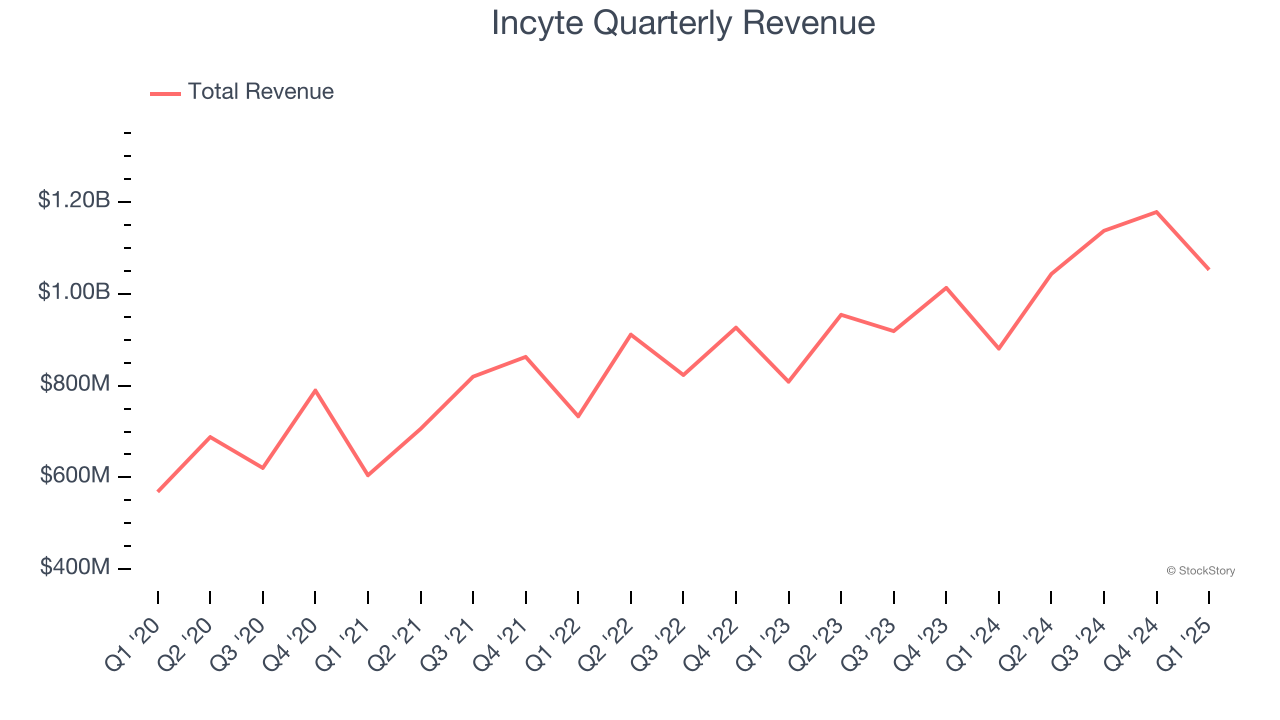
Long-term growth is the most important, but within healthcare, a half-decade historical view may miss new innovations or demand cycles. Incyte’s annualized revenue growth of 12.8% over the last two years is below its five-year trend, but we still think the results suggest healthy demand. 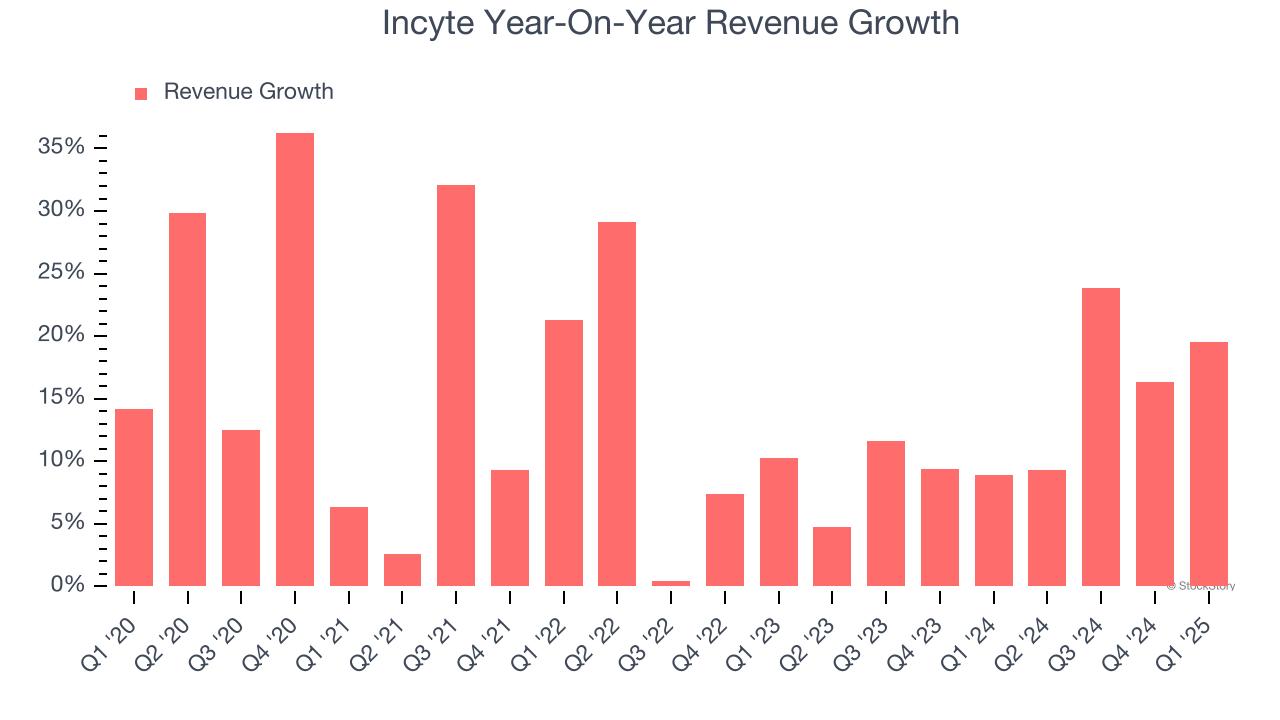
This quarter, Incyte reported year-on-year revenue growth of 19.5%, and its $1.05 billion of revenue exceeded Wall Street’s estimates by 6.5%.
Looking ahead, sell-side analysts expect revenue to grow 8.3% over the next 12 months, a deceleration versus the last two years. Despite the slowdown, this projection is healthy and implies the market is baking in success for its products and services.
Software is eating the world and there is virtually no industry left that has been untouched by it. That drives increasing demand for tools helping software developers do their jobs, whether it be monitoring critical cloud infrastructure, integrating audio and video functionality, or ensuring smooth content streaming. Click here to access a free report on our 3 favorite stocks to play this generational megatrend.
Operating Margin
Incyte has done a decent job managing its cost base over the last five years. The company has produced an average operating margin of 14%, higher than the broader healthcare sector.
Analyzing the trend in its profitability, Incyte’s operating margin decreased by 14.5 percentage points over the last five years. The company’s two-year trajectory also shows it failed to get its profitability back to the peak as its margin fell by 10.1 percentage points. This performance was poor no matter how you look at it - it shows its expenses were rising and it couldn’t pass those costs onto its customers.
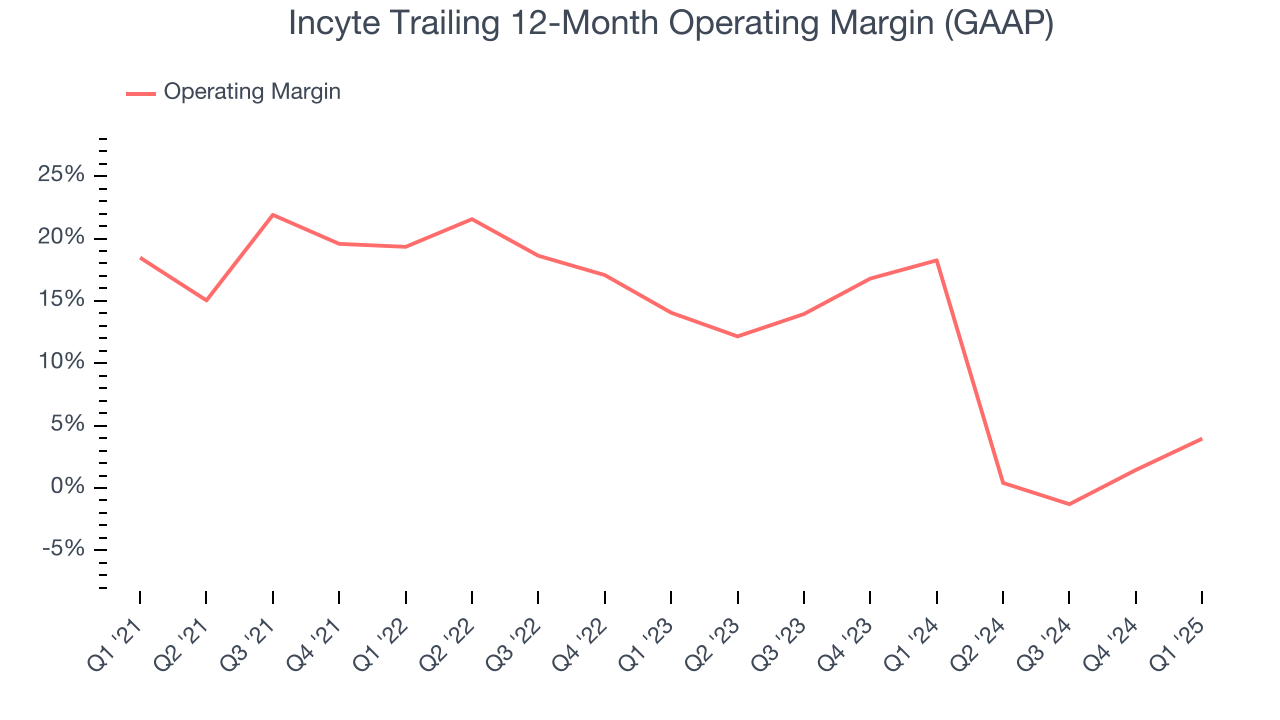
This quarter, Incyte generated an operating profit margin of 19.5%, up 9.1 percentage points year on year. This increase was a welcome development and shows it was more efficient.
Earnings Per Share
Revenue trends explain a company’s historical growth, but the long-term change in earnings per share (EPS) points to the profitability of that growth – for example, a company could inflate its sales through excessive spending on advertising and promotions.
Incyte’s full-year EPS flipped from negative to positive over the last five years. This is encouraging and shows it’s at a critical moment in its life.
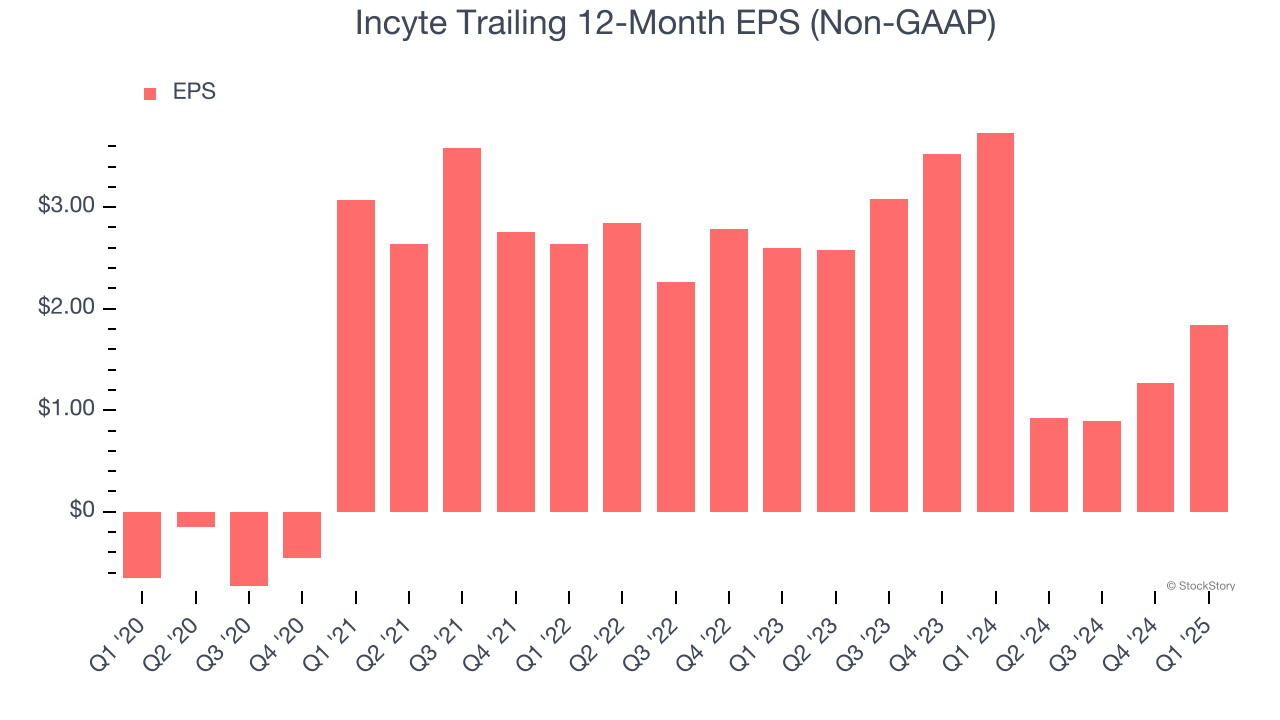
In Q1, Incyte reported EPS at $1.16, up from $0.58 in the same quarter last year. This print easily cleared analysts’ estimates, and shareholders should be content with the results. Over the next 12 months, Wall Street expects Incyte’s full-year EPS of $1.84 to grow 220%.
Key Takeaways from Incyte’s Q1 Results
We were impressed by how significantly Incyte blew past analysts’ revenue expectations this quarter. We were also happy its EPS outperformed Wall Street’s estimates. Zooming out, we think this was a solid quarter. The stock remained flat at $59.52 immediately after reporting.
Incyte had an encouraging quarter, but one earnings result doesn’t necessarily make the stock a buy. Let’s see if this is a good investment. If you’re making that decision, you should consider the bigger picture of valuation, business qualities, as well as the latest earnings. We cover that in our actionable full research report which you can read here, it’s free.