Engineered materials manufacturer Rogers (NYSE: ROG) beat Wall Street’s revenue expectations in Q1 CY2025, but sales fell by 10.7% year on year to $190.5 million. The company expects next quarter’s revenue to be around $197.5 million, close to analysts’ estimates. Its non-GAAP profit of $0.27 per share was 6.6% above analysts’ consensus estimates.
Is now the time to buy Rogers? Find out by accessing our full research report, it’s free.
Rogers (ROG) Q1 CY2025 Highlights:
- Revenue: $190.5 million vs analyst estimates of $186.3 million (10.7% year-on-year decline, 2.2% beat)
- Adjusted EPS: $0.27 vs analyst estimates of $0.25 (6.6% beat)
- Adjusted EBITDA: $19.5 million vs analyst estimates of $17.2 million (10.2% margin, 13.4% beat)
- Revenue Guidance for Q2 CY2025 is $197.5 million at the midpoint, roughly in line with what analysts were expecting
- Adjusted EPS guidance for Q2 CY2025 is $0.50 at the midpoint, above analyst estimates of $0.40
- Operating Margin: -0.2%, down from 5.5% in the same quarter last year
- Free Cash Flow Margin: 1.1%, down from 8.8% in the same quarter last year
- Market Capitalization: $1.07 billion
"Our first quarter unfolded largely as we expected with financial results that were in line with our guidance expectations,” stated Colin Gouveia, Rogers' President and CEO.
Company Overview
With roots dating back to 1832, making it one of America's oldest continuously operating companies, Rogers (NYSE: ROG) designs and manufactures specialized engineered materials and components used in electric vehicles, telecommunications, renewable energy, and other high-performance applications.
Sales Growth
Examining a company’s long-term performance can provide clues about its quality. Any business can put up a good quarter or two, but many enduring ones grow for years.
With $807.2 million in revenue over the past 12 months, Rogers is a small player in the business services space, which sometimes brings disadvantages compared to larger competitors benefiting from economies of scale and numerous distribution channels.
As you can see below, Rogers’s demand was weak over the last five years. Its sales fell by 1.2% annually, a tough starting point for our analysis.
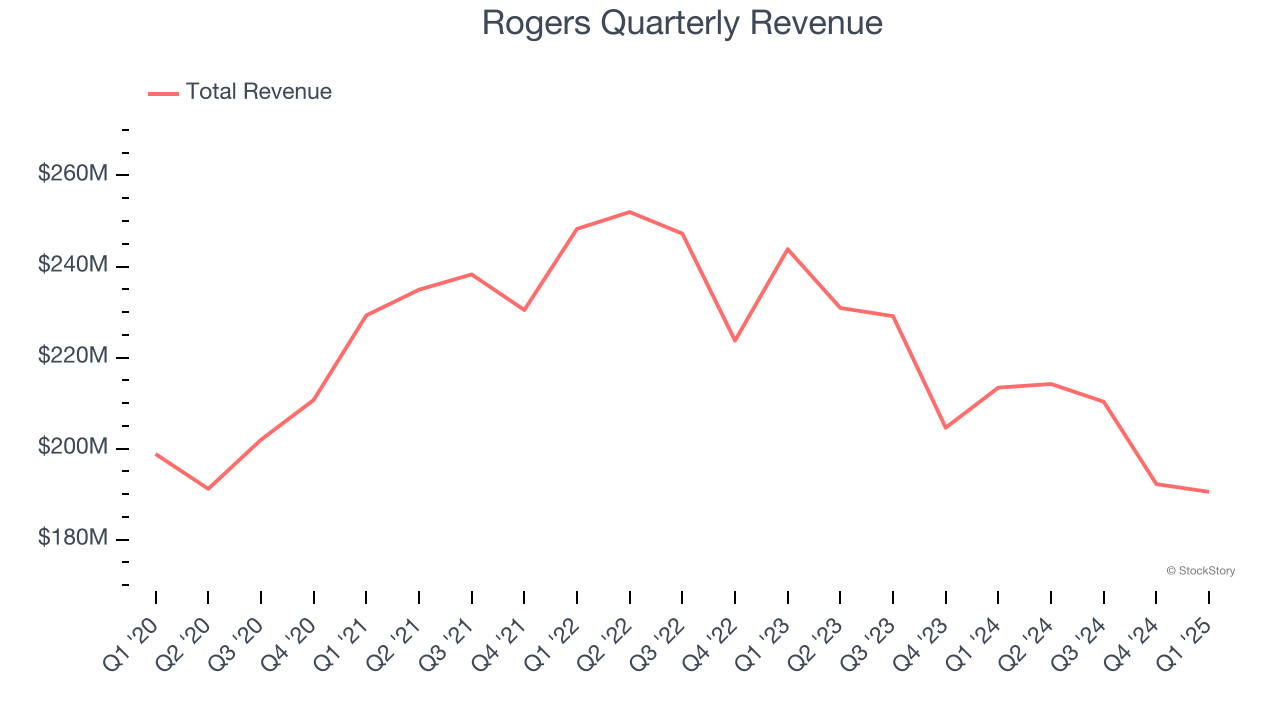
We at StockStory place the most emphasis on long-term growth, but within business services, a half-decade historical view may miss recent innovations or disruptive industry trends. Rogers’s recent performance shows its demand remained suppressed as its revenue has declined by 8.6% annually over the last two years. 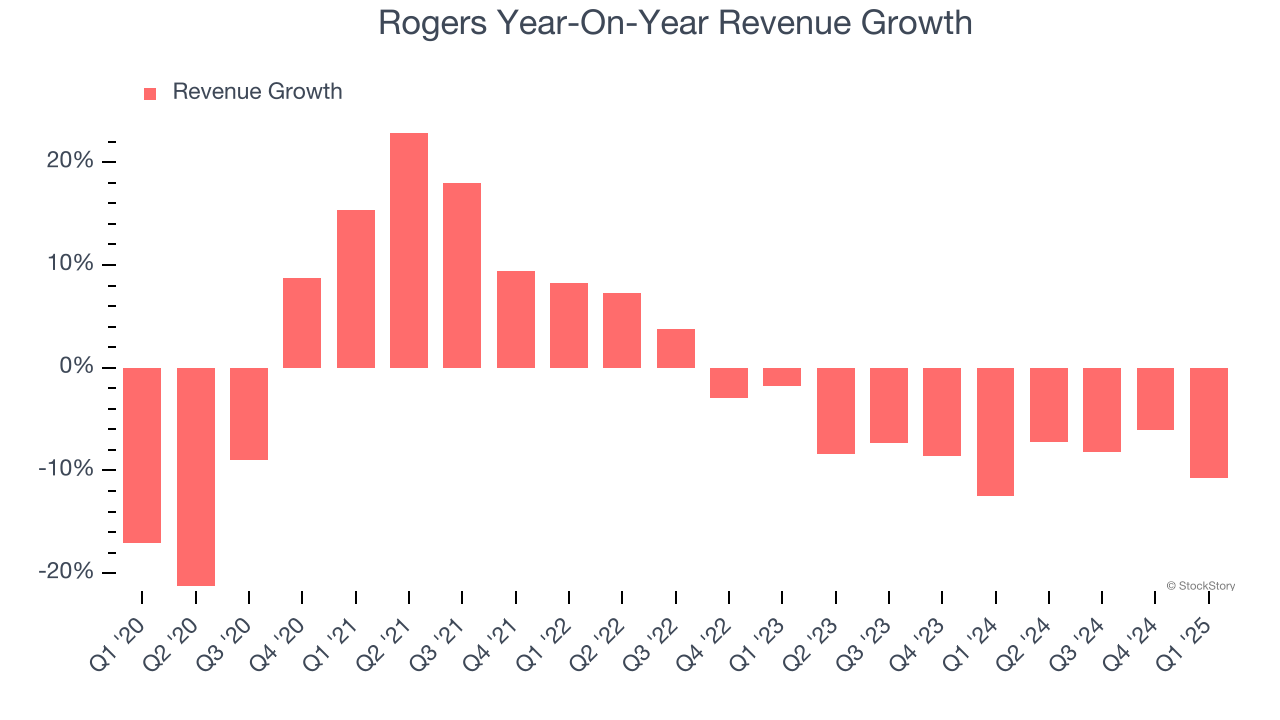
This quarter, Rogers’s revenue fell by 10.7% year on year to $190.5 million but beat Wall Street’s estimates by 2.2%. Company management is currently guiding for a 7.8% year-on-year decline in sales next quarter.
Looking further ahead, sell-side analysts expect revenue to grow 1.6% over the next 12 months. While this projection indicates its newer products and services will spur better top-line performance, it is still below the sector average.
Here at StockStory, we certainly understand the potential of thematic investing. Diverse winners from Microsoft (MSFT) to Alphabet (GOOG), Coca-Cola (KO) to Monster Beverage (MNST) could all have been identified as promising growth stories with a megatrend driving the growth. So, in that spirit, we’ve identified a relatively under-the-radar profitable growth stock benefiting from the rise of AI, available to you FREE via this link.
Operating Margin
Operating margin is one of the best measures of profitability because it tells us how much money a company takes home after subtracting all core expenses, like marketing and R&D.
Rogers was profitable over the last five years but held back by its large cost base. Its average operating margin of 9.1% was weak for a business services business.
Analyzing the trend in its profitability, Rogers’s operating margin decreased by 11.2 percentage points over the last five years. Rogers’s performance was poor no matter how you look at it - it shows that costs were rising and it couldn’t pass them onto its customers.
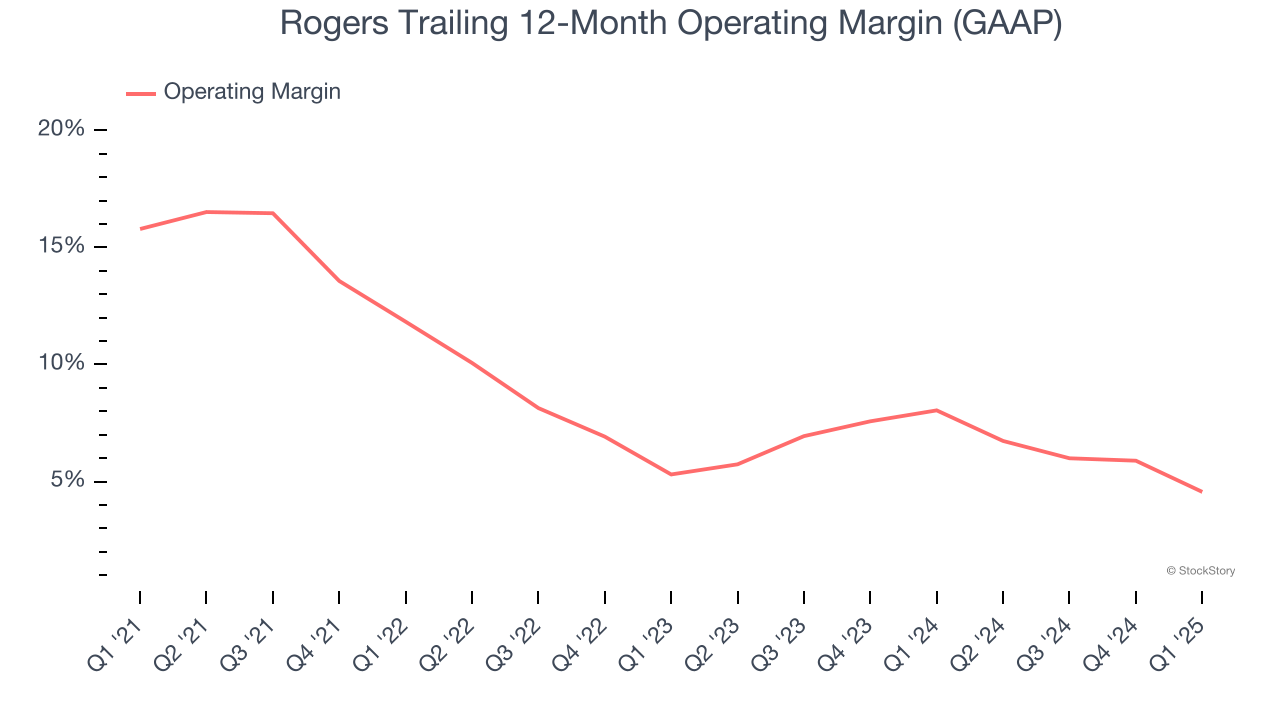
This quarter, Rogers’s breakeven margin was down 5.7 percentage points year on year. This contraction shows it was less efficient because its expenses increased relative to its revenue.
Earnings Per Share
We track the long-term change in earnings per share (EPS) for the same reason as long-term revenue growth. Compared to revenue, however, EPS highlights whether a company’s growth is profitable.
Sadly for Rogers, its EPS declined by 14.4% annually over the last five years, more than its revenue. This tells us the company struggled because its fixed cost base made it difficult to adjust to shrinking demand.
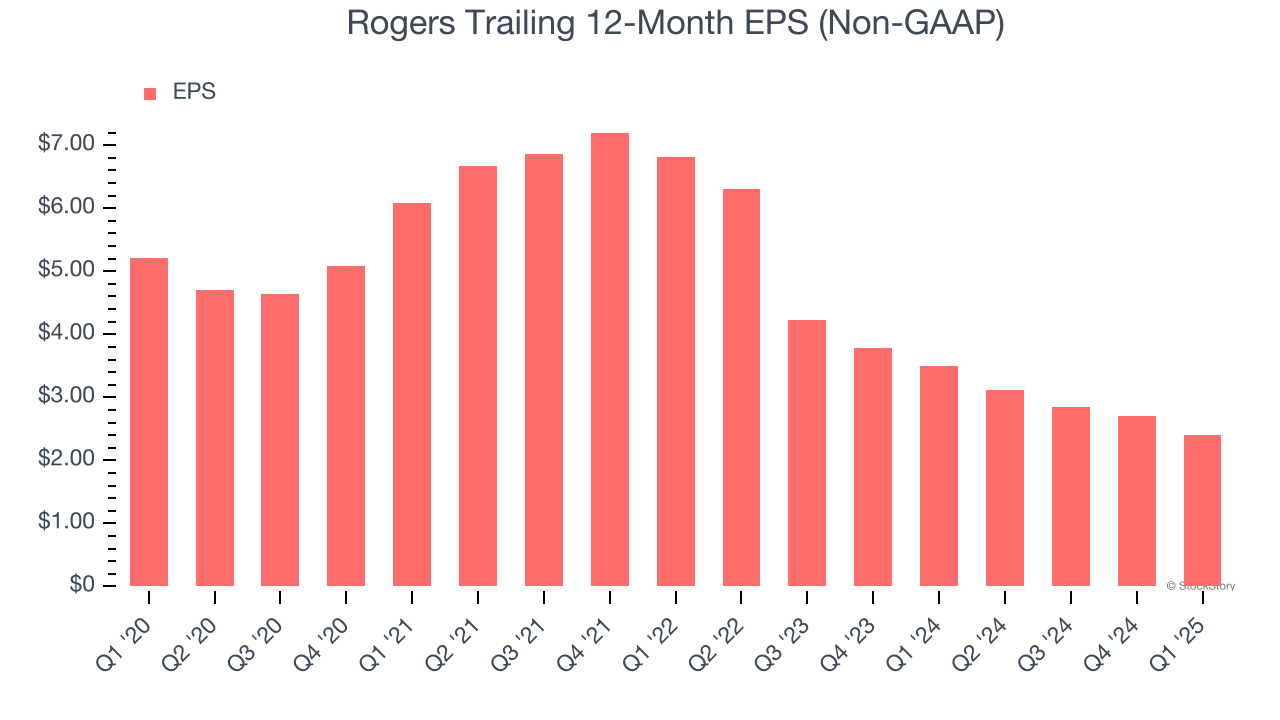
We can take a deeper look into Rogers’s earnings to better understand the drivers of its performance. As we mentioned earlier, Rogers’s operating margin declined by 11.2 percentage points over the last five years. This was the most relevant factor (aside from the revenue impact) behind its lower earnings; taxes and interest expenses can also affect EPS but don’t tell us as much about a company’s fundamentals.
In Q1, Rogers reported EPS at $0.27, down from $0.58 in the same quarter last year. Despite falling year on year, this print beat analysts’ estimates by 6.6%. Over the next 12 months, Wall Street expects Rogers’s full-year EPS of $2.40 to grow 9.7%.
Key Takeaways from Rogers’s Q1 Results
We were impressed by how significantly Rogers blew past analysts’ EPS guidance for next quarter expectations this quarter. We were also happy its revenue, EPS, and EBITDA outperformed Wall Street’s estimates. Overall, we think this was a solid quarter with some key metrics above expectations. The stock remained flat at $59.43 immediately following the results.
Should you buy the stock or not? We think that the latest quarter is only one piece of the longer-term business quality puzzle. Quality, when combined with valuation, can help determine if the stock is a buy. We cover that in our actionable full research report which you can read here, it’s free.