Water analytics and treatment company Veralto (NYSE: VLTO) announced better-than-expected revenue in Q1 CY2025, with sales up 6.9% year on year to $1.33 billion. The company expects next quarter’s revenue to be around $1.32 billion, close to analysts’ estimates. Its non-GAAP profit of $0.95 per share was 9.7% above analysts’ consensus estimates.
Is now the time to buy Veralto? Find out by accessing our full research report, it’s free.
Veralto (VLTO) Q1 CY2025 Highlights:
- Revenue: $1.33 billion vs analyst estimates of $1.28 billion (6.9% year-on-year growth, 4.1% beat)
- Adjusted EPS: $0.95 vs analyst estimates of $0.87 (9.7% beat)
- Revenue Guidance for Q2 CY2025 is $1.32 billion at the midpoint, roughly in line with what analysts were expecting
- Management reiterated its full-year Adjusted EPS guidance of $3.65 at the midpoint
- Operating Margin: 24.2%, in line with the same quarter last year
- Free Cash Flow Margin: 10.7%, up from 8.2% in the same quarter last year
- Market Capitalization: $22.84 billion
Company Overview
Spun off from Danaher in 2023, Veralto (NYSE: VLTO) provides water analytics and treatment solutions.
Sales Growth
Reviewing a company’s long-term sales performance reveals insights into its quality. Even a bad business can shine for one or two quarters, but a top-tier one grows for years. Unfortunately, Veralto’s 3.8% annualized revenue growth over the last three years was sluggish. This was below our standard for the industrials sector and is a tough starting point for our analysis.
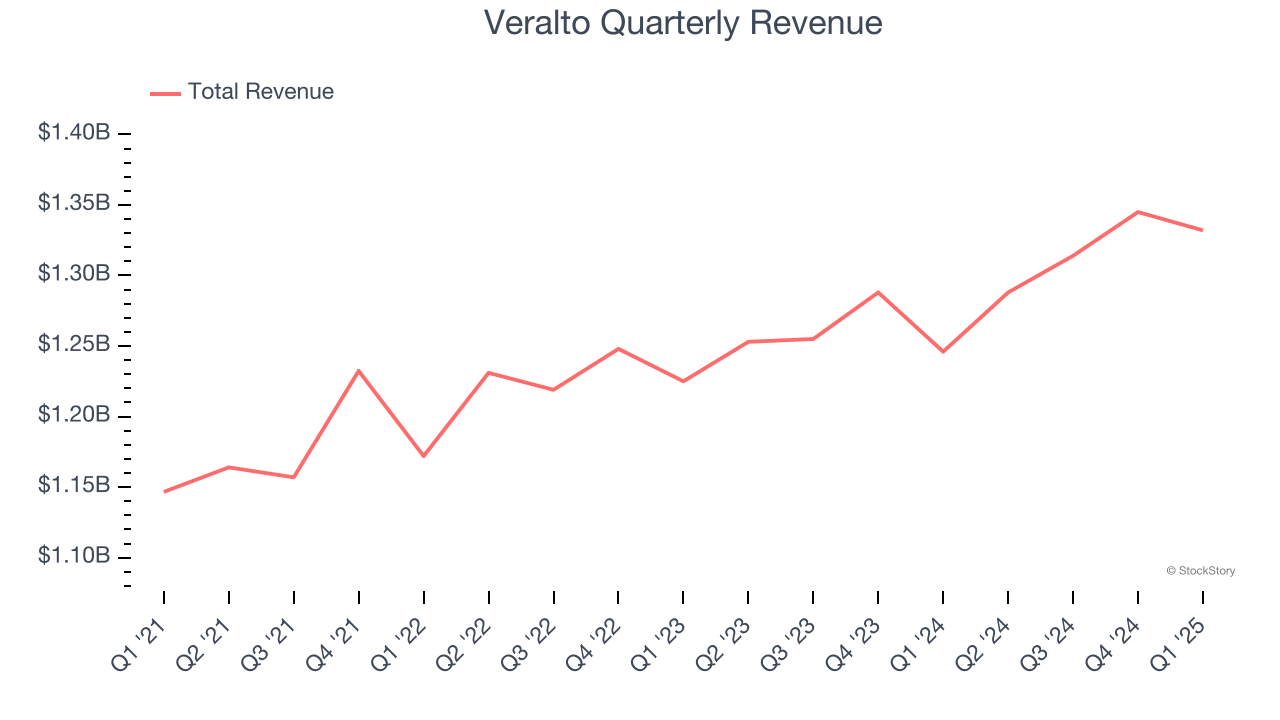
Long-term growth is the most important, but within industrials, a stretched historical view may miss new industry trends or demand cycles. Veralto’s annualized revenue growth of 3.6% over the last two years aligns with its three-year trend, suggesting its demand was consistently weak. 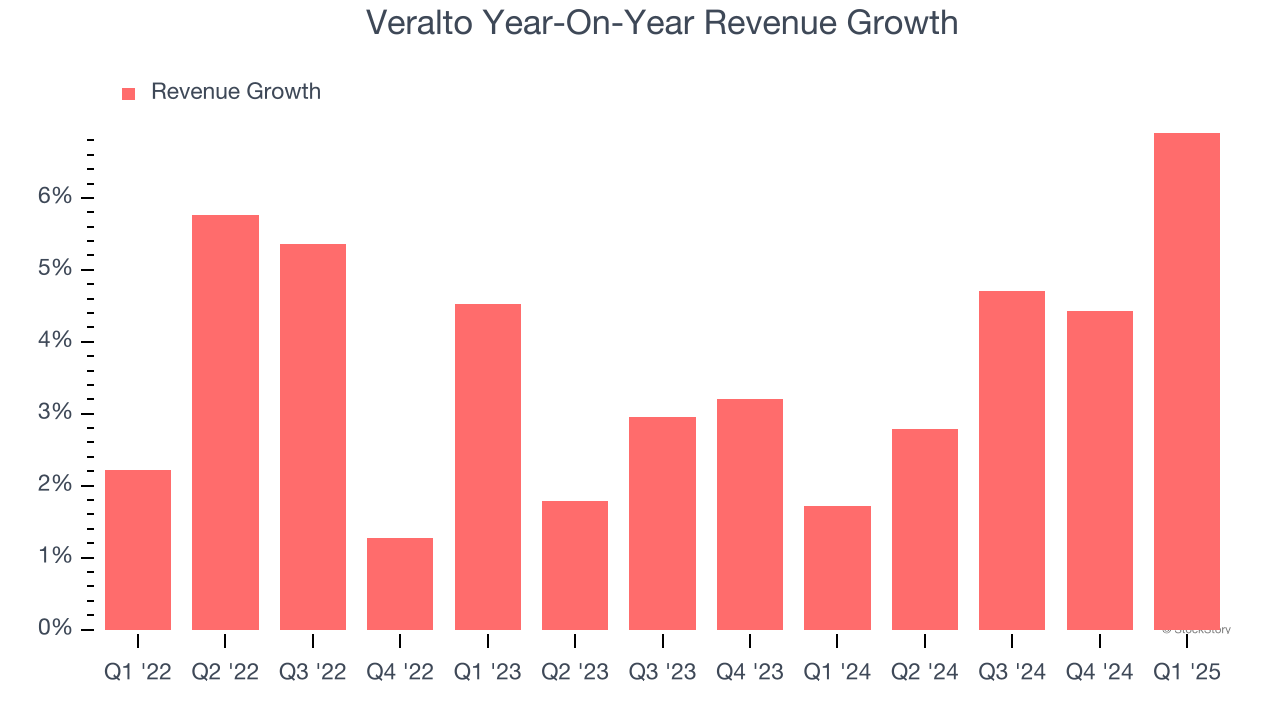
This quarter, Veralto reported year-on-year revenue growth of 6.9%, and its $1.33 billion of revenue exceeded Wall Street’s estimates by 4.1%. Company management is currently guiding for a 2.5% year-on-year increase in sales next quarter.
Looking further ahead, sell-side analysts expect revenue to grow 1.8% over the next 12 months, a slight deceleration versus the last two years. This projection doesn't excite us and indicates its products and services will see some demand headwinds.
Software is eating the world and there is virtually no industry left that has been untouched by it. That drives increasing demand for tools helping software developers do their jobs, whether it be monitoring critical cloud infrastructure, integrating audio and video functionality, or ensuring smooth content streaming. Click here to access a free report on our 3 favorite stocks to play this generational megatrend.
Operating Margin
Operating margin is a key measure of profitability. Think of it as net income - the bottom line - excluding the impact of taxes and interest on debt, which are less connected to business fundamentals.
Veralto has been a well-oiled machine over the last four years. It demonstrated elite profitability for an industrials business, boasting an average operating margin of 22.8%. This result isn’t surprising as its high gross margin gives it a favorable starting point.
Looking at the trend in its profitability, Veralto’s operating margin rose by 2 percentage points over the last four years, as its sales growth gave it operating leverage.
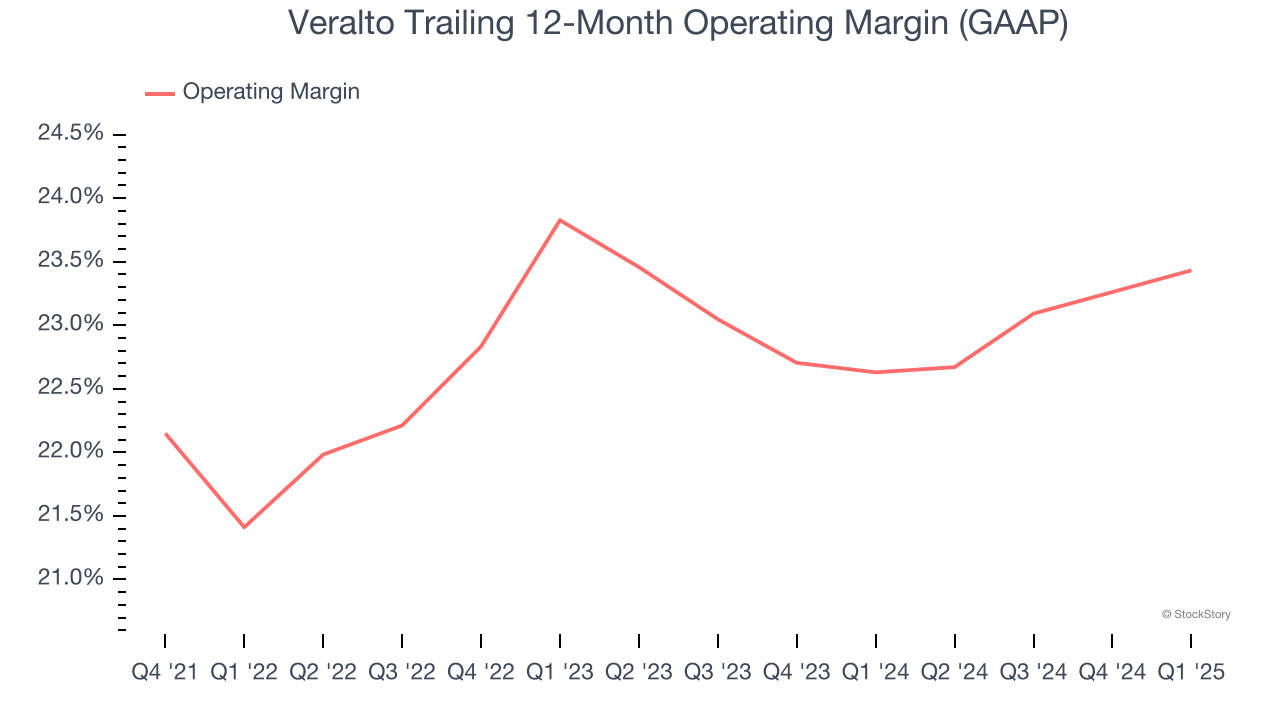
In Q1, Veralto generated an operating profit margin of 24.2%, in line with the same quarter last year. This indicates the company’s cost structure has recently been stable.
Earnings Per Share
Revenue trends explain a company’s historical growth, but the change in earnings per share (EPS) points to the profitability of that growth – for example, a company could inflate its sales through excessive spending on advertising and promotions.
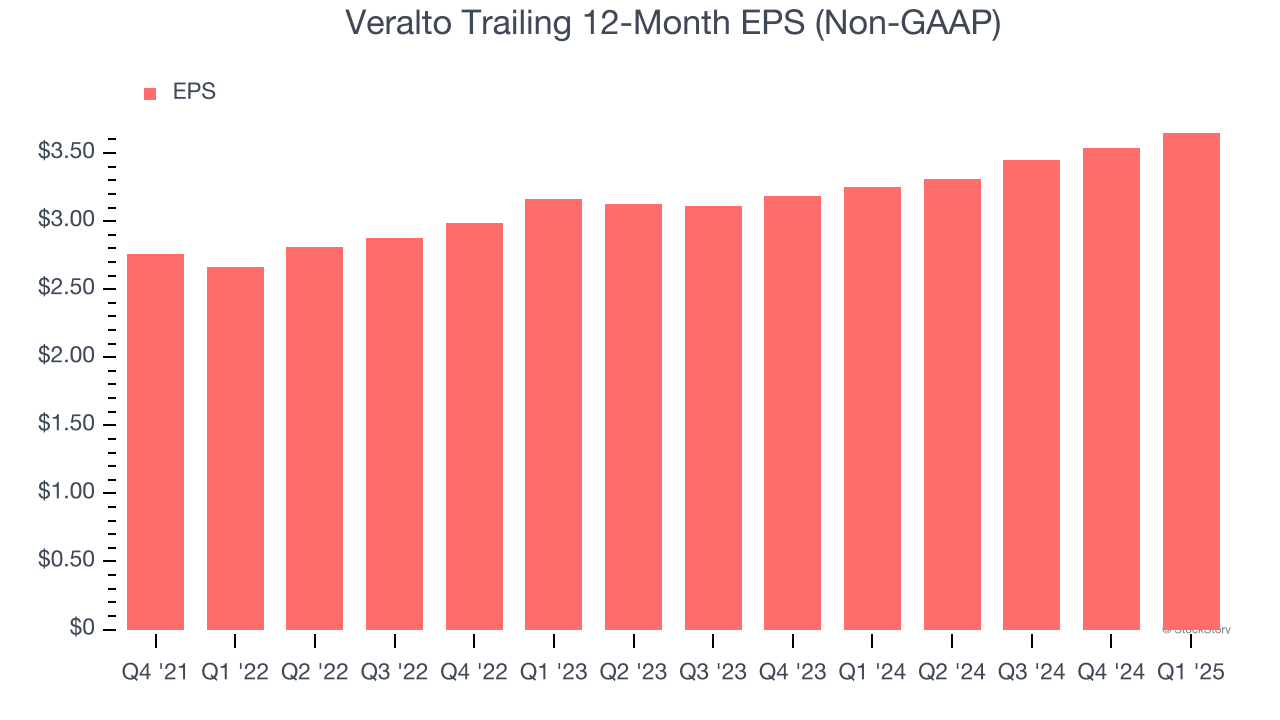
Veralto’s EPS grew at an unimpressive 7.4% compounded annual growth rate over the last two years. This performance was better than its 3.8% annualized revenue growth but doesn’t tell us much about its efficiency because its operating margin didn’t expand during this time.
In Q1, Veralto reported EPS at $0.95, up from $0.84 in the same quarter last year. This print beat analysts’ estimates by 9.7%. Over the next 12 months, Wall Street expects Veralto’s full-year EPS of $3.65 to grow 2.1%.
Key Takeaways from Veralto’s Q1 Results
We were impressed by how significantly Veralto blew past analysts’ revenue and EPS expectations this quarter. On the other hand, its EPS guidance for next quarter missed significantly. Still, this quarter had some key positives. The stock traded up 2.1% to $95 immediately following the results.
Veralto may have had a good quarter, but does that mean you should invest right now? What happened in the latest quarter matters, but not as much as longer-term business quality and valuation, when deciding whether to invest in this stock. We cover that in our actionable full research report which you can read here, it’s free.