
Diabetes technology company Tandem Diabetes Care (NASDAQ: TNDM) beat Wall Street’s revenue expectations in Q1 CY2025, with sales up 22.3% year on year to $234.4 million. The company expects the full year’s revenue to be around $1 billion, close to analysts’ estimates. Its GAAP loss of $1.97 per share was significantly below analysts’ consensus estimates.
Is now the time to buy Tandem Diabetes? Find out by accessing our full research report, it’s free.
Tandem Diabetes (TNDM) Q1 CY2025 Highlights:
- Revenue: $234.4 million vs analyst estimates of $219.4 million (22.3% year-on-year growth, 6.8% beat)
- EPS (GAAP): -$1.97 vs analyst estimates of -$0.59 (significant miss)
- Adjusted EBITDA: -$4.69 million vs analyst estimates of -$14.43 million (-2% margin, 67.5% beat)
- The company reconfirmed its revenue guidance for the full year of $1 billion at the midpoint
- Operating Margin: -51.6%, down from -21.7% in the same quarter last year
- Sales Volumes rose 13.3% year on year (-11.8% in the same quarter last year)
- Market Capitalization: $1.12 billion
Company Overview
With technology that automatically adjusts insulin delivery based on continuous glucose monitoring data, Tandem Diabetes Care (NASDAQ: TNDM) develops and manufactures automated insulin delivery systems that help people with diabetes manage their blood glucose levels.
Sales Growth
A company’s long-term sales performance can indicate its overall quality. Any business can put up a good quarter or two, but the best consistently grow over the long haul. Thankfully, Tandem Diabetes’s 20% annualized revenue growth over the last five years was impressive. Its growth beat the average healthcare company and shows its offerings resonate with customers.
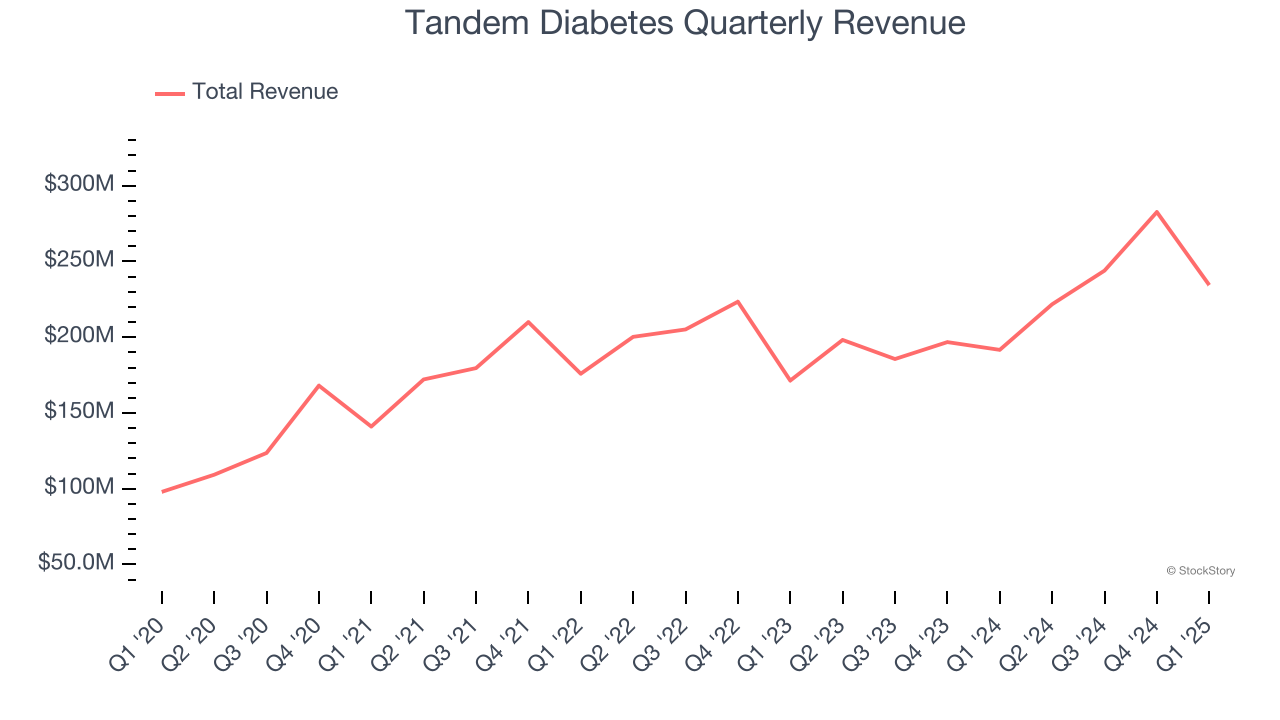
Long-term growth is the most important, but within healthcare, a half-decade historical view may miss new innovations or demand cycles. Tandem Diabetes’s annualized revenue growth of 10.8% over the last two years is below its five-year trend, but we still think the results were respectable. 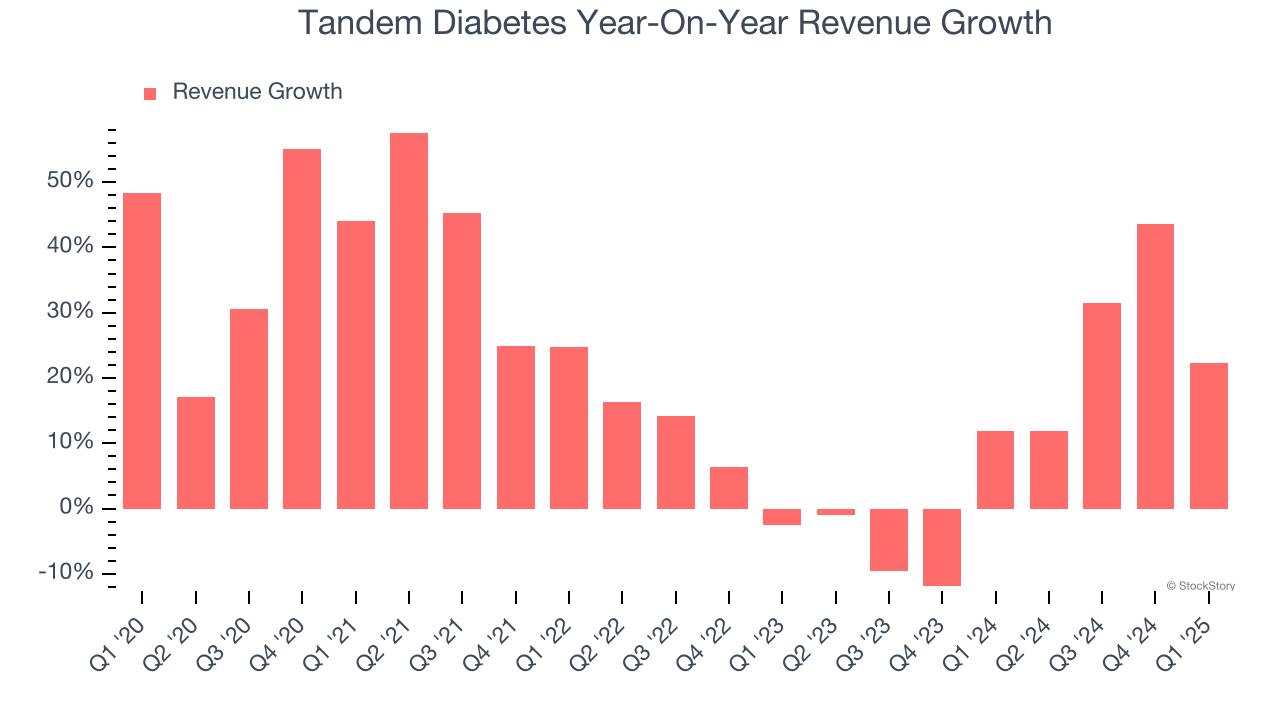
Tandem Diabetes also reports its number of pump shipments, which reached 17,000 in the latest quarter. Over the last two years, Tandem Diabetes’s pump shipments averaged 1% year-on-year growth. Because this number is lower than its revenue growth, we can see the company benefited from price increases. 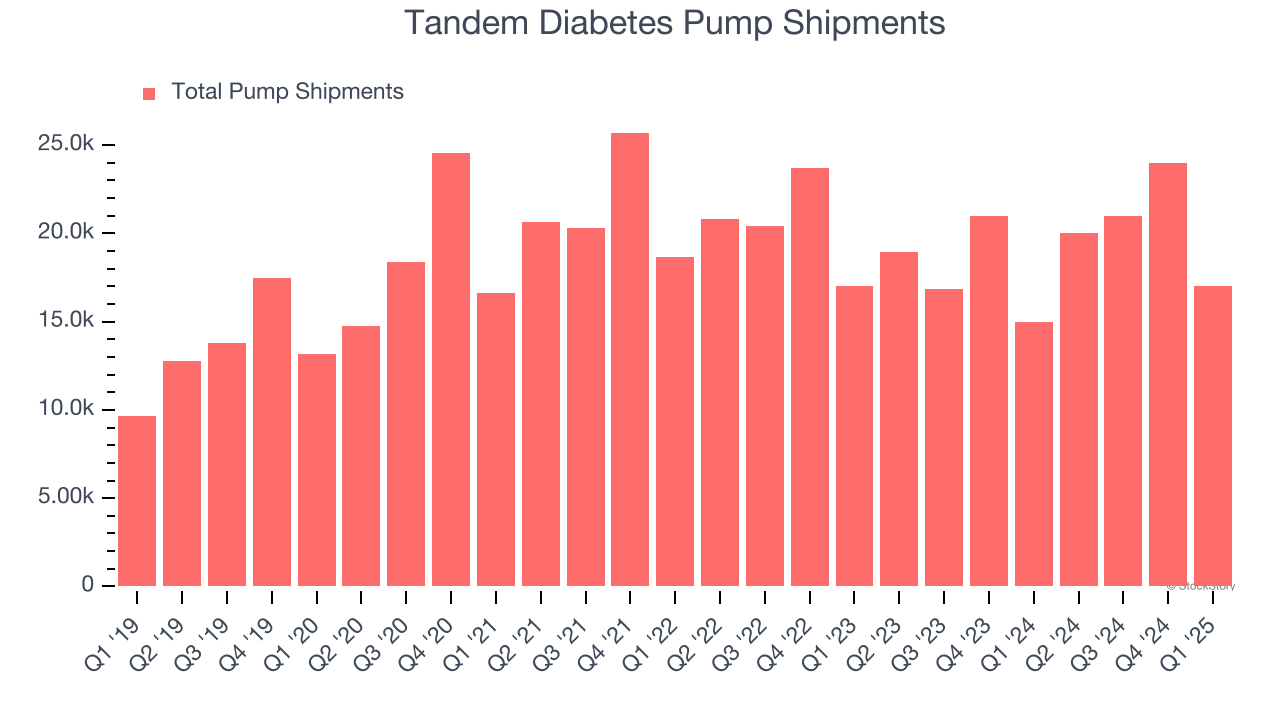
This quarter, Tandem Diabetes reported robust year-on-year revenue growth of 22.3%, and its $234.4 million of revenue topped Wall Street estimates by 6.8%.
Looking ahead, sell-side analysts expect revenue to grow 3.9% over the next 12 months, a deceleration versus the last two years. This projection doesn't excite us and suggests its products and services will face some demand challenges.
Here at StockStory, we certainly understand the potential of thematic investing. Diverse winners from Microsoft (MSFT) to Alphabet (GOOG), Coca-Cola (KO) to Monster Beverage (MNST) could all have been identified as promising growth stories with a megatrend driving the growth. So, in that spirit, we’ve identified a relatively under-the-radar profitable growth stock benefiting from the rise of AI, available to you FREE via this link.
Adjusted Operating Margin
Tandem Diabetes’s high expenses have contributed to an average adjusted operating margin of negative 7.6% over the last five years. Unprofitable healthcare companies require extra attention because they could get caught swimming naked when the tide goes out. It’s hard to trust that the business can endure a full cycle.
Analyzing the trend in its profitability, Tandem Diabetes’s adjusted operating margin decreased by 12.9 percentage points over the last five years. The company’s two-year trajectory also shows it failed to get its profitability back to the peak as its margin fell by 3.1 percentage points. This performance was poor no matter how you look at it - it shows its expenses were rising and it couldn’t pass those costs onto its customers.
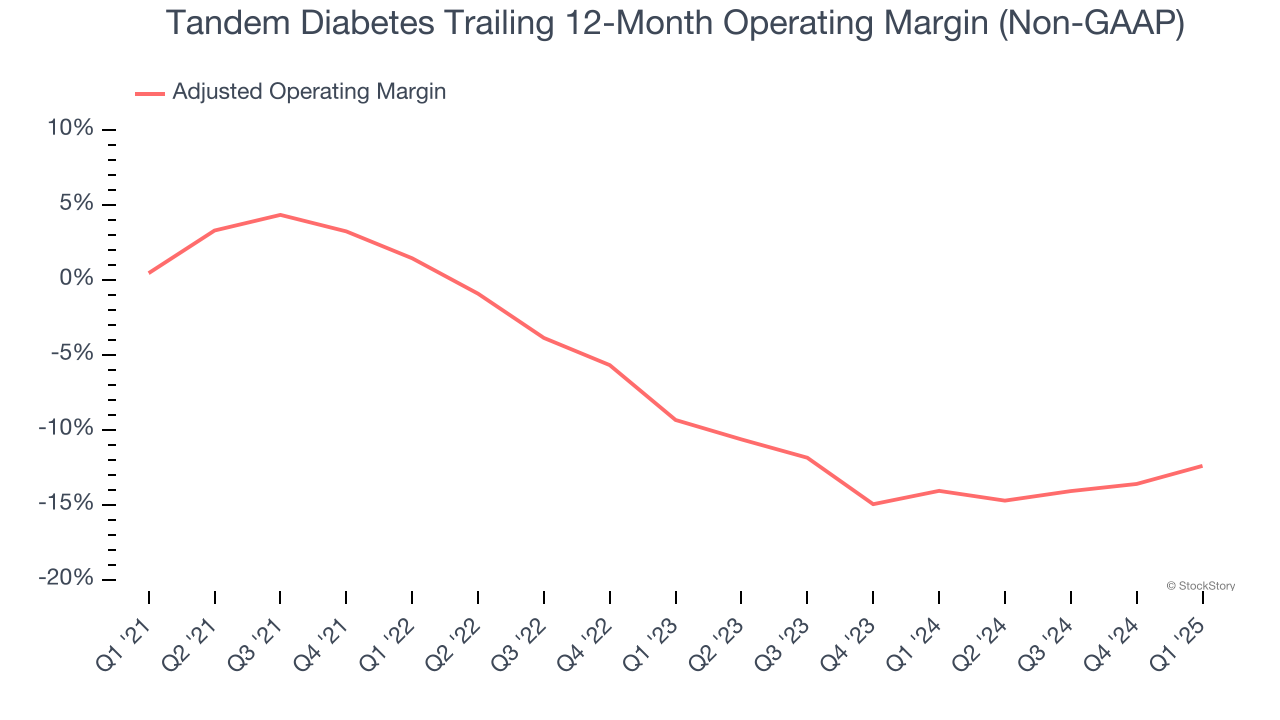
In Q1, Tandem Diabetes generated a negative 14.7% adjusted operating margin. The company's consistent lack of profits raise a flag.
Earnings Per Share
We track the long-term change in earnings per share (EPS) for the same reason as long-term revenue growth. Compared to revenue, however, EPS highlights whether a company’s growth is profitable.
Tandem Diabetes’s earnings losses deepened over the last five years as its EPS dropped 57.3% annually. We tend to steer our readers away from companies with falling EPS, where diminishing earnings could imply changing secular trends and preferences. If the tide turns unexpectedly, Tandem Diabetes’s low margin of safety could leave its stock price susceptible to large downswings.
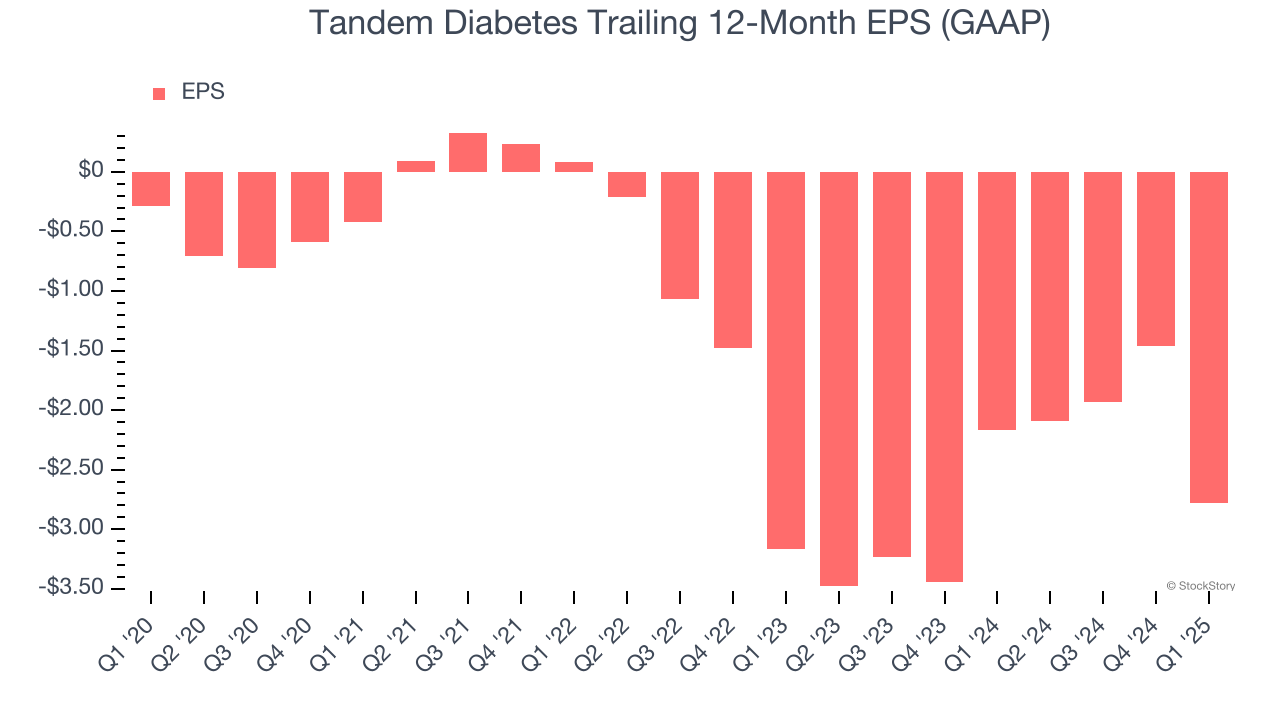
In Q1, Tandem Diabetes reported EPS at negative $1.97, down from negative $0.65 in the same quarter last year. This print missed analysts’ estimates. Over the next 12 months, Wall Street expects Tandem Diabetes to improve its earnings losses. Analysts forecast its full-year EPS of negative $2.78 will advance to negative $1.04.
Key Takeaways from Tandem Diabetes’s Q1 Results
We were impressed by how significantly Tandem Diabetes blew past analysts’ revenue, sales volume, and EBITDA expectations this quarter. On the other hand, its EPS missed significantly due to a non-recurring facility impairment charge. Overall, this quarter had some key positives. The stock traded up 5.5% to $17.75 immediately following the results.
So do we think Tandem Diabetes is an attractive buy at the current price? What happened in the latest quarter matters, but not as much as longer-term business quality and valuation, when deciding whether to invest in this stock. We cover that in our actionable full research report which you can read here, it’s free.


