
In a sliding market, OSI Systems has defied the odds, trading up to $178.81 per share. Its 22.9% gain since October 2024 has outpaced the S&P 500’s 7% drop. This was partly due to its solid quarterly results, and the run-up might have investors contemplating their next move.
Is it too late to buy OSIS? Find out in our full research report, it’s free.
Why Does OSI Systems Spark Debate?
With security scanners deployed at airports and borders worldwide and patient monitors used in hospitals across the globe, OSI Systems (NASDAQ: OSIS) designs and manufactures specialized electronic systems for security screening, patient monitoring, and optoelectronic applications.
Two Positive Attributes:
1. Long-Term Revenue Growth Shows Momentum
Reviewing a company’s long-term sales performance reveals insights into its quality. Any business can put up a good quarter or two, but the best consistently grow over the long haul. Thankfully, OSI Systems’s 6.4% annualized revenue growth over the last five years was decent. Its growth was slightly above the average business services company and shows its offerings resonate with customers. 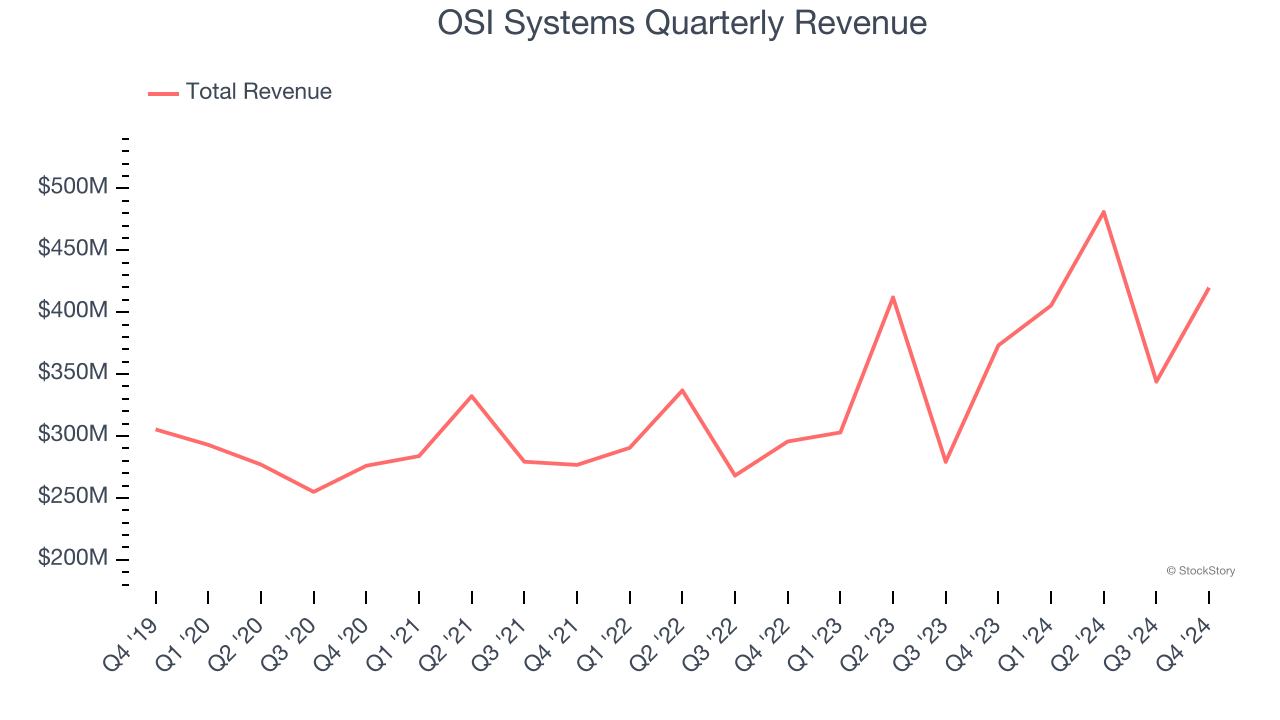
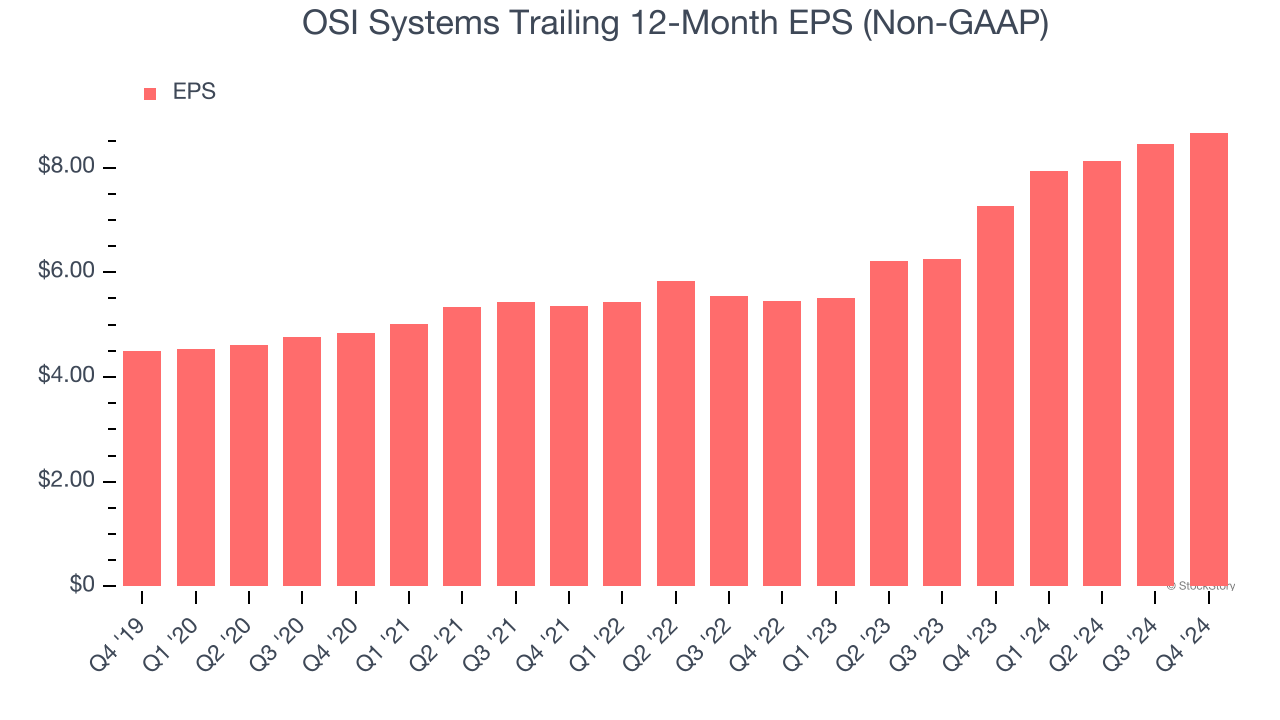
2. Outstanding Long-Term EPS Growth
Analyzing the long-term change in earnings per share (EPS) shows whether a company's incremental sales were profitable – for example, revenue could be inflated through excessive spending on advertising and promotions.
OSI Systems’s EPS grew at a spectacular 14% compounded annual growth rate over the last five years, higher than its 6.4% annualized revenue growth. This tells us the company became more profitable on a per-share basis as it expanded.
One Reason to be Careful:
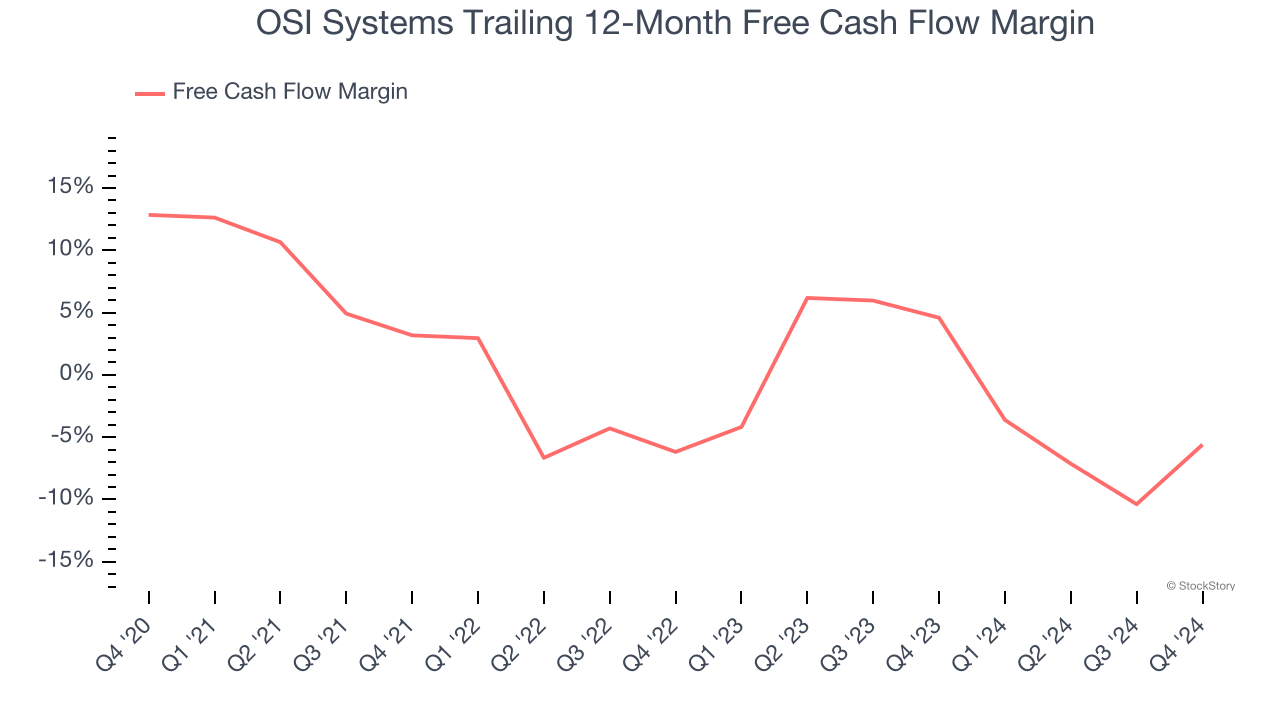
Free Cash Flow Margin Dropping
Free cash flow isn't a prominently featured metric in company financials and earnings releases, but we think it's telling because it accounts for all operating and capital expenses, making it tough to manipulate. Cash is king.
As you can see below, OSI Systems’s margin dropped by 18.4 percentage points over the last five years. If the trend continues, it could signal it’s in the middle of a big investment cycle. OSI Systems’s free cash flow margin for the trailing 12 months was negative 5.6%.
Final Judgment
OSI Systems has huge potential even though it has some open questions, and with its shares beating the market recently, the stock trades at 19.3× forward price-to-earnings (or $178.81 per share). Is now the right time to buy? See for yourself in our comprehensive research report, it’s free.
Stocks We Like Even More Than OSI Systems
The market surged in 2024 and reached record highs after Donald Trump’s presidential victory in November, but questions about new economic policies are adding much uncertainty for 2025.
While the crowd speculates what might happen next, we’re homing in on the companies that can succeed regardless of the political or macroeconomic environment. Put yourself in the driver’s seat and build a durable portfolio by checking out our Top 5 Strong Momentum Stocks for this week. This is a curated list of our High Quality stocks that have generated a market-beating return of 175% over the last five years.
Stocks that made our list in 2019 include now familiar names such as Nvidia (+2,183% between December 2019 and December 2024) as well as under-the-radar businesses like Comfort Systems (+751% five-year return). Find your next big winner with StockStory today for free.