Starbucks has followed the market’s trajectory closely. The stock is down 8.8% to $88.10 per share over the past six months while the S&P 500 has lost 6.9%. This might have investors contemplating their next move.
Is there a buying opportunity in Starbucks, or does it present a risk to your portfolio? Dive into our full research report to see our analyst team’s opinion, it’s free.
Despite the more favorable entry price, we're cautious about Starbucks. Here are three reasons why you should be careful with SBUX and a stock we'd rather own.
Why Is Starbucks Not Exciting?
Started by three friends in Seattle’s historic Pike Place Market, Starbucks (NASDAQ: SBUX) is a globally-renowned coffeehouse chain that offers a wide selection of high-quality coffee, beverages, and food items.
1. Long-Term Revenue Growth Disappoints
Reviewing a company’s long-term sales performance reveals insights into its quality. Any business can put up a good quarter or two, but many enduring ones grow for years. Unfortunately, Starbucks’s 6% annualized revenue growth over the last five years was mediocre. This was below our standard for the restaurant sector. 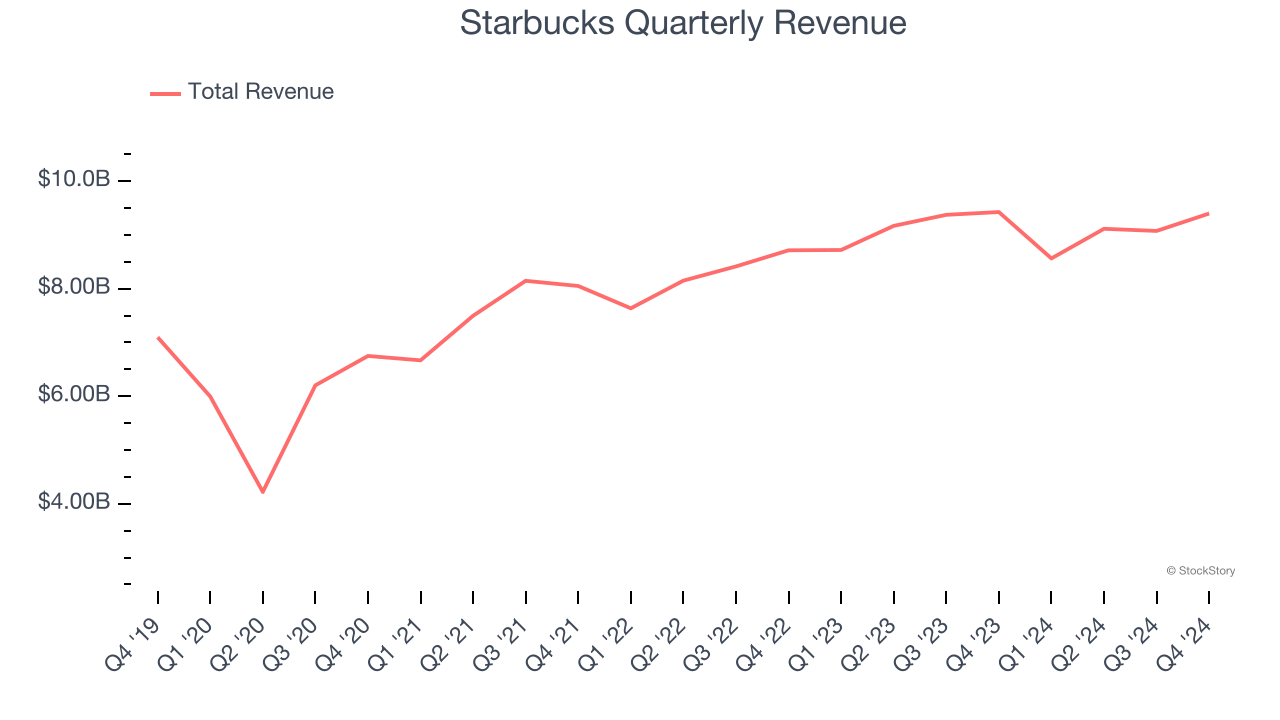
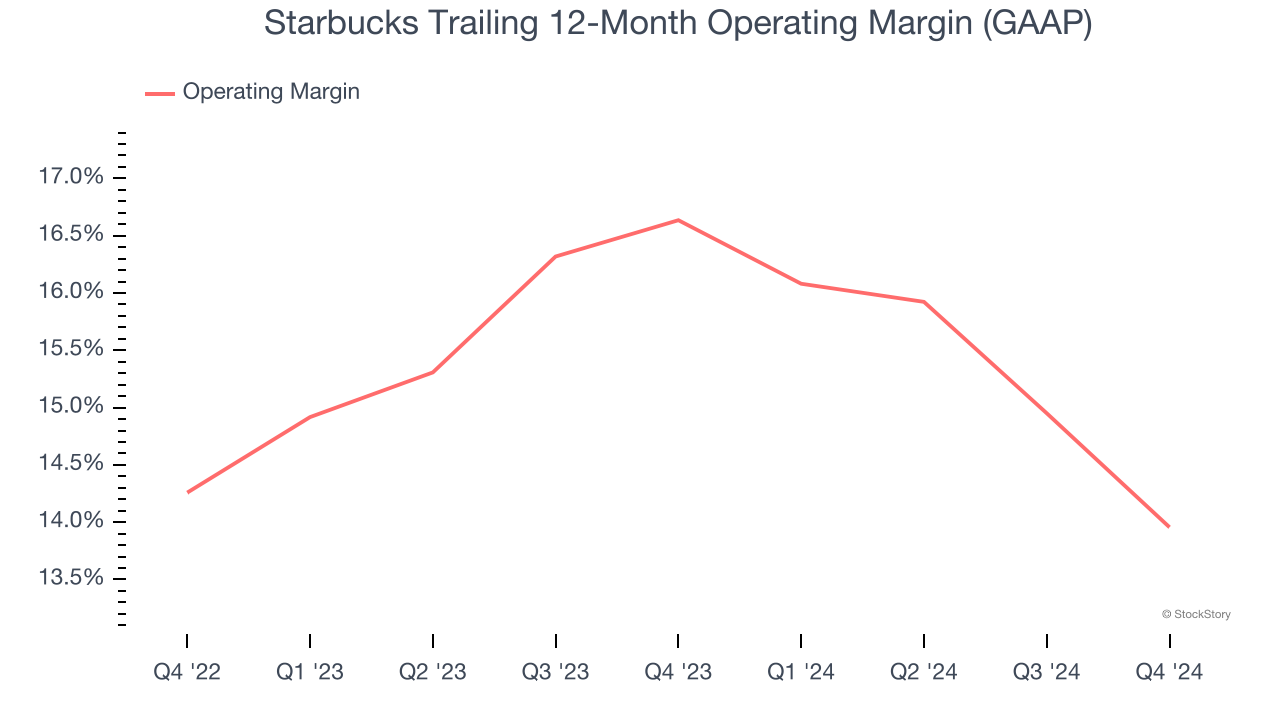
2. Shrinking Operating Margin
Operating margin is a key profitability metric because it accounts for all expenses keeping the business in motion, including food costs, wages, rent, advertising, and other administrative costs.
Looking at the trend in its profitability, Starbucks’s operating margin decreased by 2.7 percentage points over the last year. This raises questions about the company’s expense base because its revenue growth should have given it leverage on its fixed costs, resulting in better economies of scale and profitability. Its operating margin for the trailing 12 months was 14%.
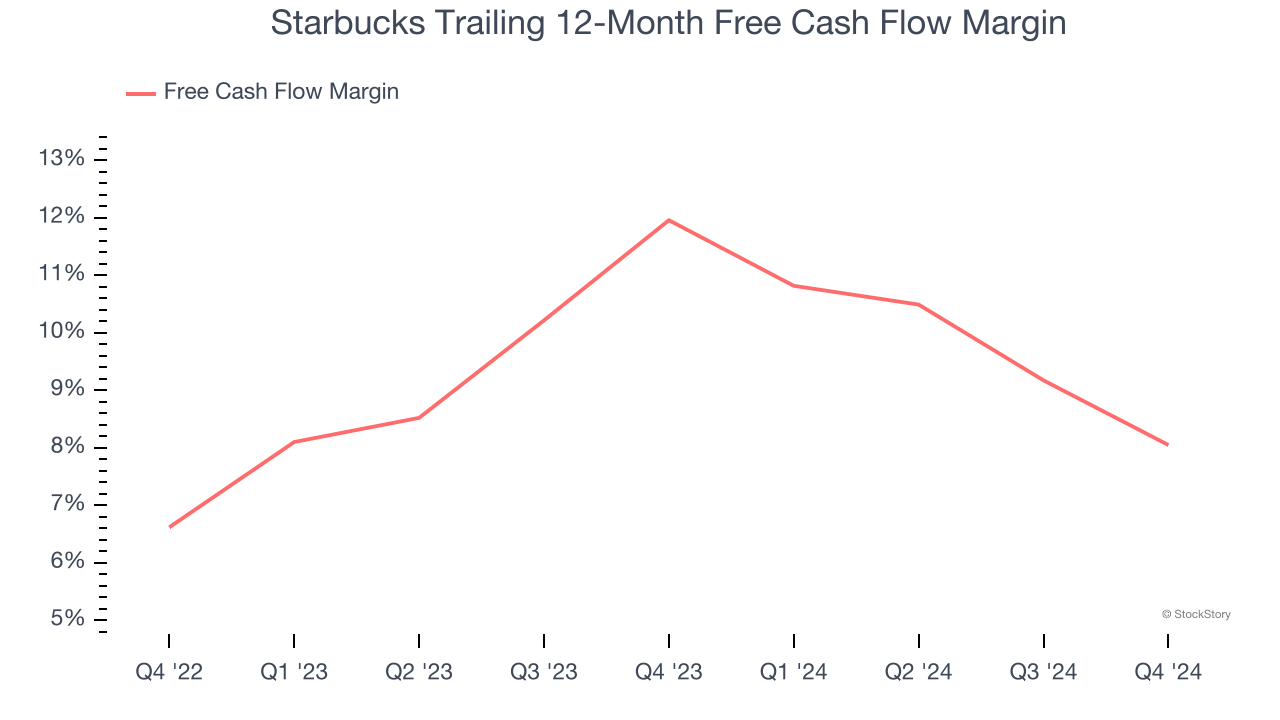
3. Free Cash Flow Margin Dropping
If you’ve followed StockStory for a while, you know we emphasize free cash flow. Why, you ask? We believe that in the end, cash is king, and you can’t use accounting profits to pay the bills.
As you can see below, Starbucks’s margin dropped by 3.9 percentage points over the last year. This decrease came from the higher costs associated with opening more restaurants.
Final Judgment
Starbucks’s business quality ultimately falls short of our standards. After the recent drawdown, the stock trades at 27.1× forward price-to-earnings (or $88.10 per share). This multiple tells us a lot of good news is priced in - we think there are better stocks to buy right now. We’d suggest looking at our favorite semiconductor picks and shovels play.
Stocks We Like More Than Starbucks
The market surged in 2024 and reached record highs after Donald Trump’s presidential victory in November, but questions about new economic policies are adding much uncertainty for 2025.
While the crowd speculates what might happen next, we’re homing in on the companies that can succeed regardless of the political or macroeconomic environment. Put yourself in the driver’s seat and build a durable portfolio by checking out our Top 5 Strong Momentum Stocks for this week. This is a curated list of our High Quality stocks that have generated a market-beating return of 175% over the last five years.
Stocks that made our list in 2019 include now familiar names such as Nvidia (+2,183% between December 2019 and December 2024) as well as under-the-radar businesses like Comfort Systems (+751% five-year return). Find your next big winner with StockStory today for free.