Since October 2024, John Bean has been in a holding pattern, posting a small return of 3.7% while floating around $102.36. However, the stock is beating the S&P 500’s 10.6% decline during that period.
Is now the time to buy John Bean, or should you be careful about including it in your portfolio? Check out our in-depth research report to see what our analysts have to say, it’s free.
Despite the relative momentum, we don't have much confidence in John Bean. Here are three reasons why there are better opportunities than JBTM and a stock we'd rather own.
Why Do We Think John Bean Will Underperform?
Tracing back to its invention of the mechanical milk bottle filler in 1884, John Bean (NYSE: JBTM) designs, manufactures, and sells equipment used for food processing and aviation.
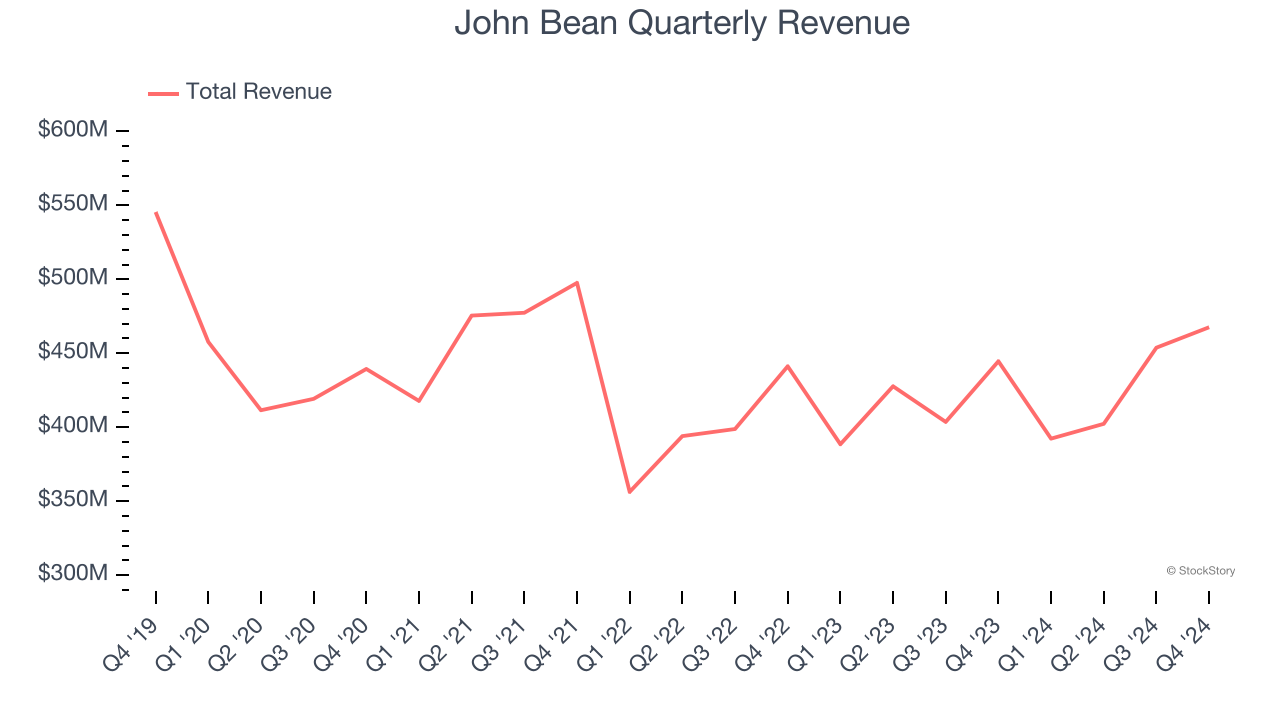
1. Revenue Spiraling Downwards
A company’s long-term sales performance can indicate its overall quality. Any business can put up a good quarter or two, but many enduring ones grow for years. John Bean struggled to consistently generate demand over the last five years as its sales dropped at a 2.5% annual rate. This was below our standards and signals it’s a low quality business.
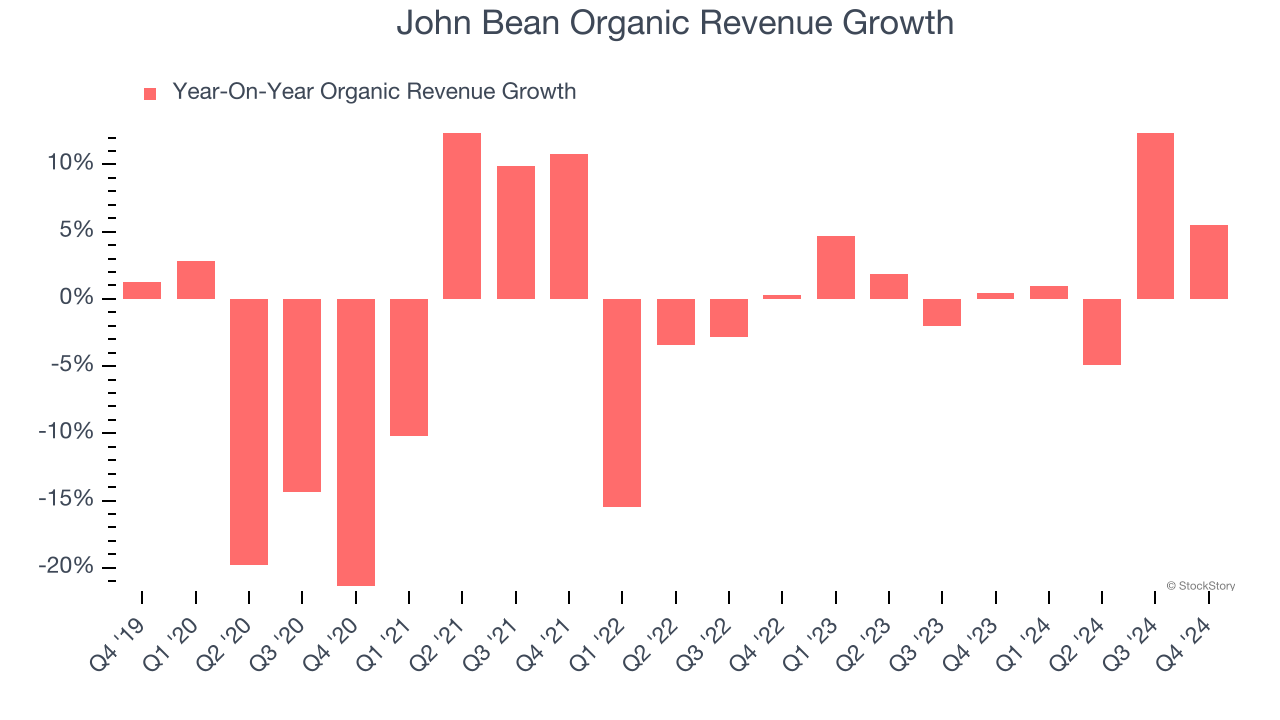
2. Slow Organic Growth Suggests Waning Demand In Core Business
In addition to reported revenue, organic revenue is a useful data point for analyzing General Industrial Machinery companies. This metric gives visibility into John Bean’s core business because it excludes one-time events such as mergers, acquisitions, and divestitures along with foreign currency fluctuations - non-fundamental factors that can manipulate the income statement.
Over the last two years, John Bean’s organic revenue averaged 2.4% year-on-year growth. This performance was underwhelming and suggests it may need to improve its products, pricing, or go-to-market strategy, which can add an extra layer of complexity to its operations.
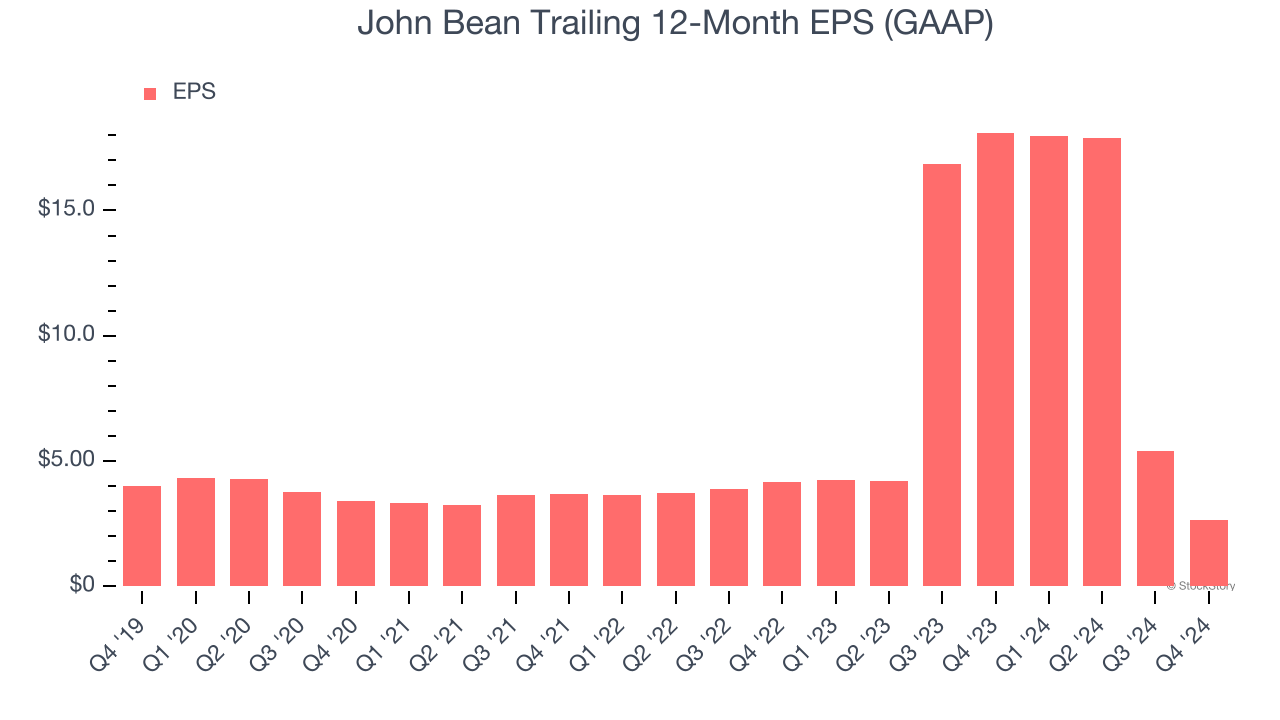
3. EPS Trending Down
We track the long-term change in earnings per share (EPS) because it highlights whether a company’s growth is profitable.
Sadly for John Bean, its EPS declined by 8% annually over the last five years, more than its revenue. This tells us the company struggled because its fixed cost base made it difficult to adjust to shrinking demand.
Final Judgment
John Bean doesn’t pass our quality test. Following its recent outperformance amid a softer market environment, the stock trades at $102.36 per share (or 0.9× forward price-to-sales). The market typically values companies like John Bean based on their anticipated profits for the next 12 months, but there aren’t enough published estimates to arrive at a reliable number. You should avoid this stock for now - better opportunities lie elsewhere. We’d recommend looking at a top digital advertising platform riding the creator economy.
Stocks We Would Buy Instead of John Bean
Donald Trump’s victory in the 2024 U.S. Presidential Election sent major indices to all-time highs, but stocks have retraced as investors debate the health of the economy and the potential impact of tariffs.
While this leaves much uncertainty around 2025, a few companies are poised for long-term gains regardless of the political or macroeconomic climate, like our Top 5 Growth Stocks for this month. This is a curated list of our High Quality stocks that have generated a market-beating return of 175% over the last five years.
Stocks that made our list in 2019 include now familiar names such as Nvidia (+2,183% between December 2019 and December 2024) as well as under-the-radar businesses like Sterling Infrastructure (+1,096% five-year return). Find your next big winner with StockStory today for free.