
The Pennant Group has gotten torched over the last six months - since October 2024, its stock price has dropped 28.3% to $24.33 per share. This might have investors contemplating their next move.
Is now the time to buy The Pennant Group, or should you be careful about including it in your portfolio? Dive into our full research report to see our analyst team’s opinion, it’s free.
Even though the stock has become cheaper, we don't have much confidence in The Pennant Group. Here are three reasons why there are better opportunities than PNTG and a stock we'd rather own.
Why Is The Pennant Group Not Exciting?
Spun off from The Ensign Group in 2019 to focus on non-skilled nursing healthcare services, Pennant Group (NASDAQ: PNTG) operates home health, hospice, and senior living facilities across 13 western and midwestern states, serving patients of all ages including seniors.
1. Fewer Distribution Channels Limit its Ceiling
Larger companies benefit from economies of scale, where fixed costs like infrastructure, technology, and administration are spread over a higher volume of goods or services, reducing the cost per unit. Scale can also lead to bargaining power with suppliers, greater brand recognition, and more investment firepower. A virtuous cycle can ensue if a scaled company plays its cards right.
With just $695.2 million in revenue over the past 12 months, The Pennant Group is a small company in an industry where scale matters. This makes it difficult to build trust with customers because healthcare is heavily regulated, complex, and resource-intensive.
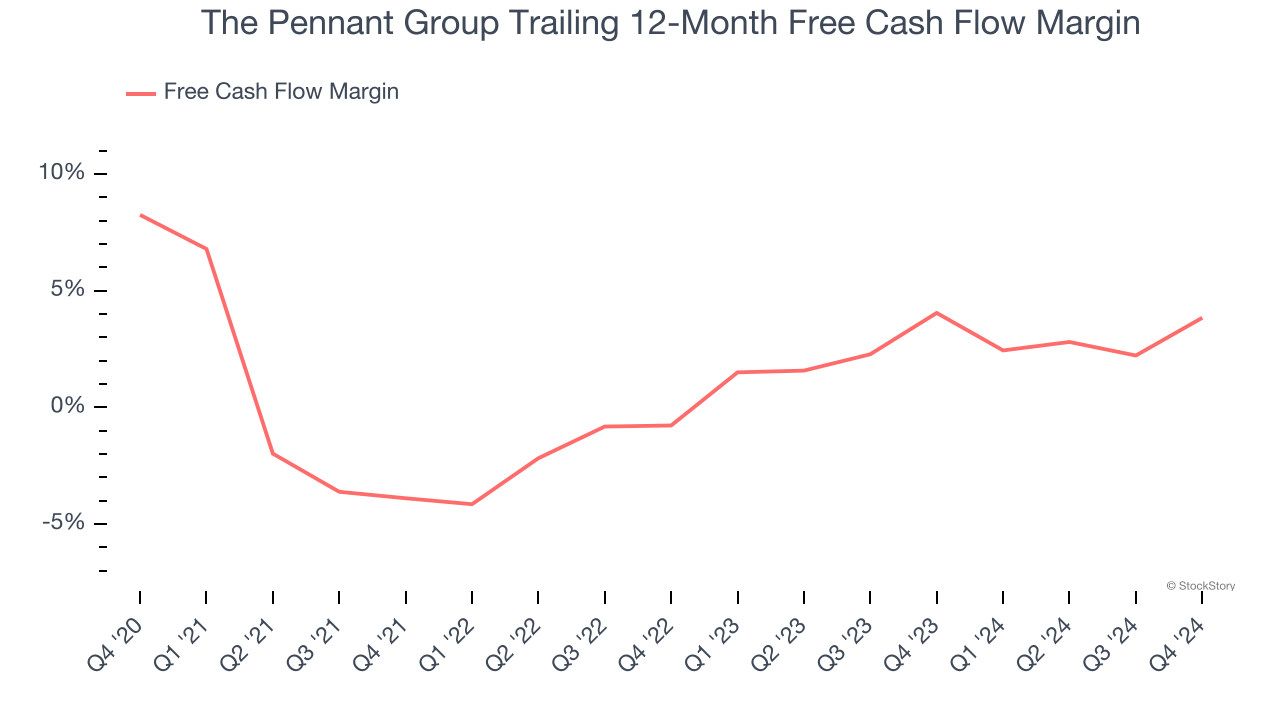
2. Free Cash Flow Margin Dropping
If you’ve followed StockStory for a while, you know we emphasize free cash flow. Why, you ask? We believe that in the end, cash is king, and you can’t use accounting profits to pay the bills.
As you can see below, The Pennant Group’s margin dropped by 4.4 percentage points over the last five years. Almost any movement in the wrong direction is undesirable because of its already low cash conversion. If the trend continues, it could signal it’s becoming a more capital-intensive business. The Pennant Group’s free cash flow margin for the trailing 12 months was 3.8%.
3. Previous Growth Initiatives Haven’t Impressed
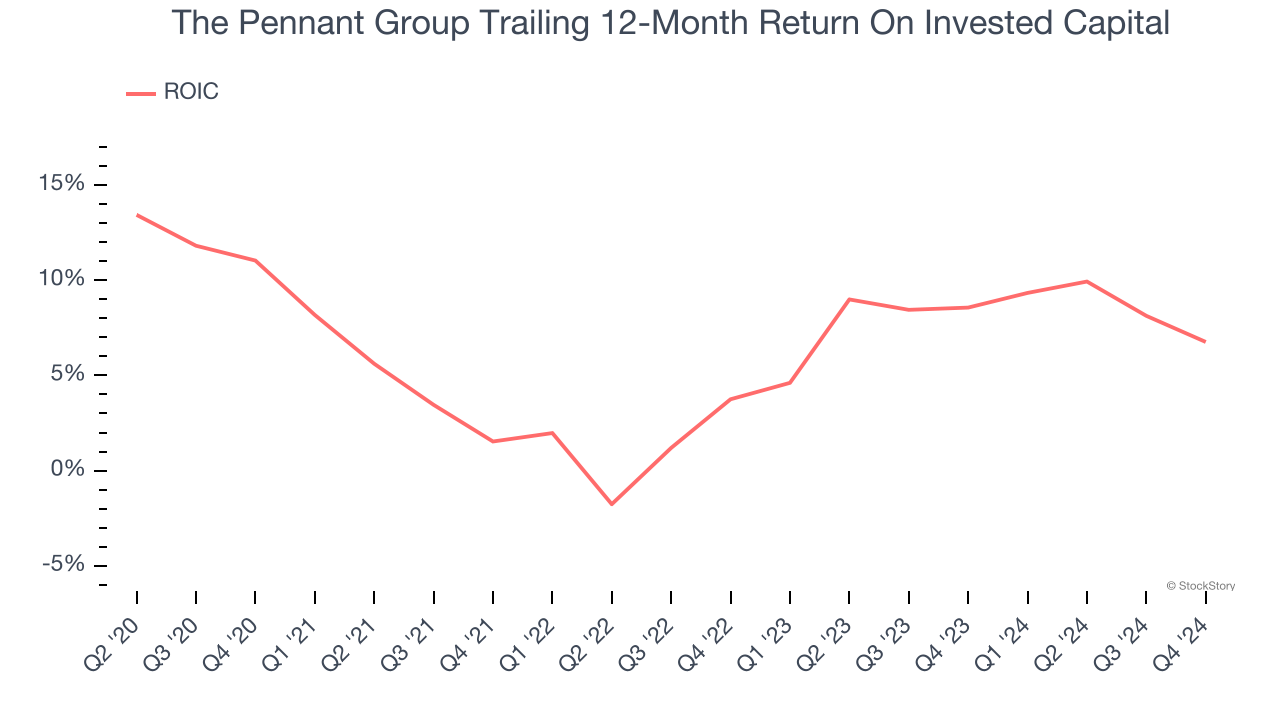
Growth gives us insight into a company’s long-term potential, but how capital-efficient was that growth? Enter ROIC, a metric showing how much operating profit a company generates relative to the money it has raised (debt and equity).
The Pennant Group historically did a mediocre job investing in profitable growth initiatives. Its five-year average ROIC was 6.3%, somewhat low compared to the best healthcare companies that consistently pump out 20%+.
Final Judgment
The Pennant Group isn’t a terrible business, but it doesn’t pass our bar. After the recent drawdown, the stock trades at 22.4× forward price-to-earnings (or $24.33 per share). This valuation tells us a lot of optimism is priced in - we think there are better opportunities elsewhere. Let us point you toward one of our top software and edge computing picks.
Stocks We Like More Than The Pennant Group
Donald Trump’s victory in the 2024 U.S. Presidential Election sent major indices to all-time highs, but stocks have retraced as investors debate the health of the economy and the potential impact of tariffs.
While this leaves much uncertainty around 2025, a few companies are poised for long-term gains regardless of the political or macroeconomic climate, like our Top 6 Stocks for this week. This is a curated list of our High Quality stocks that have generated a market-beating return of 175% over the last five years.
Stocks that made our list in 2019 include now familiar names such as Nvidia (+2,183% between December 2019 and December 2024) as well as under-the-radar businesses like Comfort Systems (+751% five-year return). Find your next big winner with StockStory today for free.