
Beer, wine, and spirits company Constellation Brands (NYSE: STZ) reported Q1 CY2025 results beating Wall Street’s revenue expectations, with sales up 1.2% year on year to $2.16 billion. Its non-GAAP profit of $2.63 per share was 15.9% above analysts’ consensus estimates.
Is now the time to buy Constellation Brands? Find out by accessing our full research report, it’s free.
Constellation Brands (STZ) Q1 CY2025 Highlights:
- Revenue: $2.16 billion vs analyst estimates of $2.12 billion (1.2% year-on-year growth, 1.9% beat)
- Adjusted EPS: $2.63 vs analyst estimates of $2.27 (15.9% beat)
- Adjusted EBITDA: -$32.6 million vs analyst estimates of $752.3 million (-1.5% margin, significant miss)
- Adjusted EPS guidance for the upcoming financial year 2026 is $12.75 at the midpoint, missing analyst estimates by 8.6%
- Operating Margin: -6.9%, down from 29.4% in the same quarter last year
- Free Cash Flow Margin: 14.4%, up from 3.6% in the same quarter last year
- Organic Revenue rose 1% year on year (7% in the same quarter last year)
- Market Capitalization: $30.89 billion
Company Overview
With a presence in more than 100 countries, Constellation Brands (NYSE: STZ) is a globally renowned producer and marketer of beer, wine, and spirits.
Beverages, Alcohol, and Tobacco
These companies' performance is influenced by brand strength, marketing strategies, and shifts in consumer preferences. Changing consumption patterns are particularly relevant and can be seen in the rise of cannabis, craft beer, and vaping or the steady decline of soda and cigarettes. Companies that spend on innovation to meet consumers where they are with regards to trends can reap huge demand benefits while those who ignore trends can see stagnant volumes. Finally, with the advent of the social media, the cost of starting a brand from scratch is much lower, meaning that new entrants can chip away at the market shares of established players.
Sales Growth
Examining a company’s long-term performance can provide clues about its quality. Even a bad business can shine for one or two quarters, but a top-tier one grows for years.
With $10.21 billion in revenue over the past 12 months, Constellation Brands is one of the larger consumer staples companies and benefits from a well-known brand that influences purchasing decisions. However, its scale is a double-edged sword because there are only a finite number of major retail partners, placing a ceiling on its growth. To expand meaningfully, Constellation Brands likely needs to tweak its prices, innovate with new products, or enter new markets.
As you can see below, Constellation Brands grew its sales at a tepid 5% compounded annual growth rate over the last three years. This shows it failed to generate demand in any major way and is a rough starting point for our analysis.
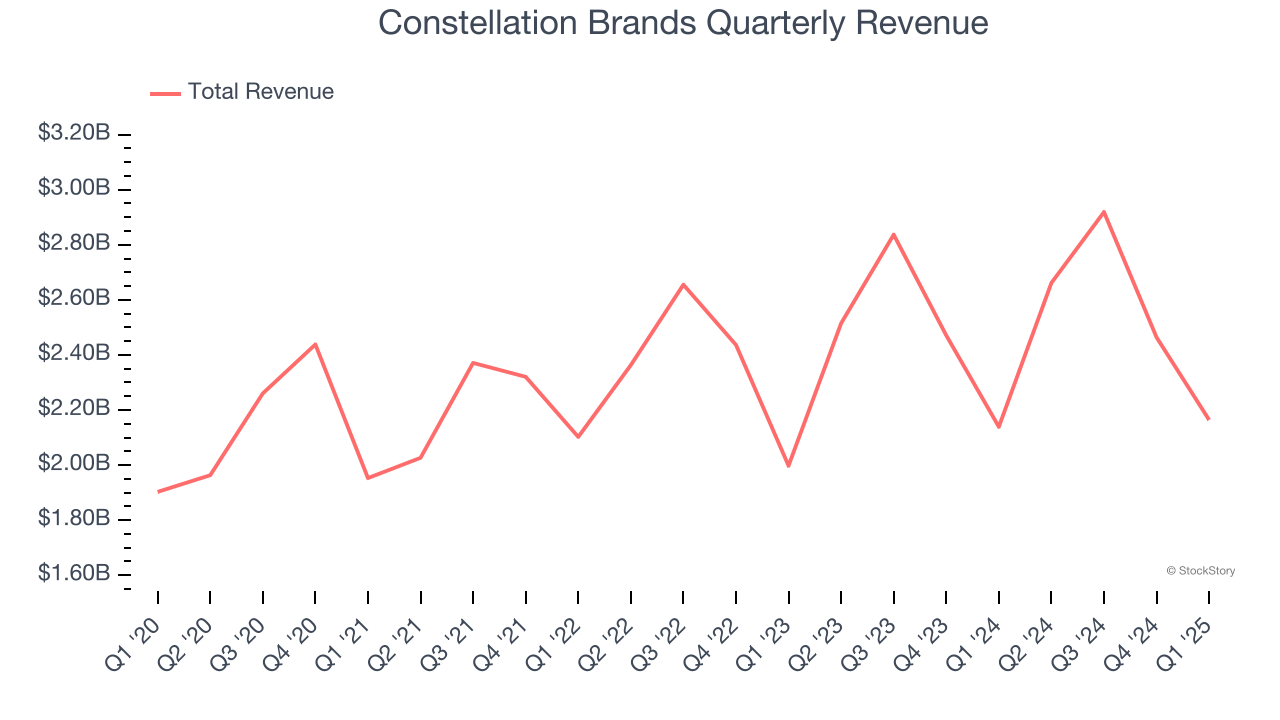
This quarter, Constellation Brands reported modest year-on-year revenue growth of 1.2% but beat Wall Street’s estimates by 1.9%.
Looking ahead, sell-side analysts expect revenue to grow 2.1% over the next 12 months, a slight deceleration versus the last three years. This projection is underwhelming and suggests its products will see some demand headwinds.
Today’s young investors won’t have read the timeless lessons in Gorilla Game: Picking Winners In High Technology because it was written more than 20 years ago when Microsoft and Apple were first establishing their supremacy. But if we apply the same principles, then enterprise software stocks leveraging their own generative AI capabilities may well be the Gorillas of the future. So, in that spirit, we are excited to present our Special Free Report on a profitable, fast-growing enterprise software stock that is already riding the automation wave and looking to catch the generative AI next.
Organic Revenue Growth
When analyzing revenue growth, we care most about organic revenue growth. This metric captures a business’s performance excluding one-time events such as mergers, acquisitions, and divestitures as well as foreign currency fluctuations.
The demand for Constellation Brands’s products has generally risen over the last two years but lagged behind the broader sector. On average, the company’s organic sales have grown by 4.1% year on year. 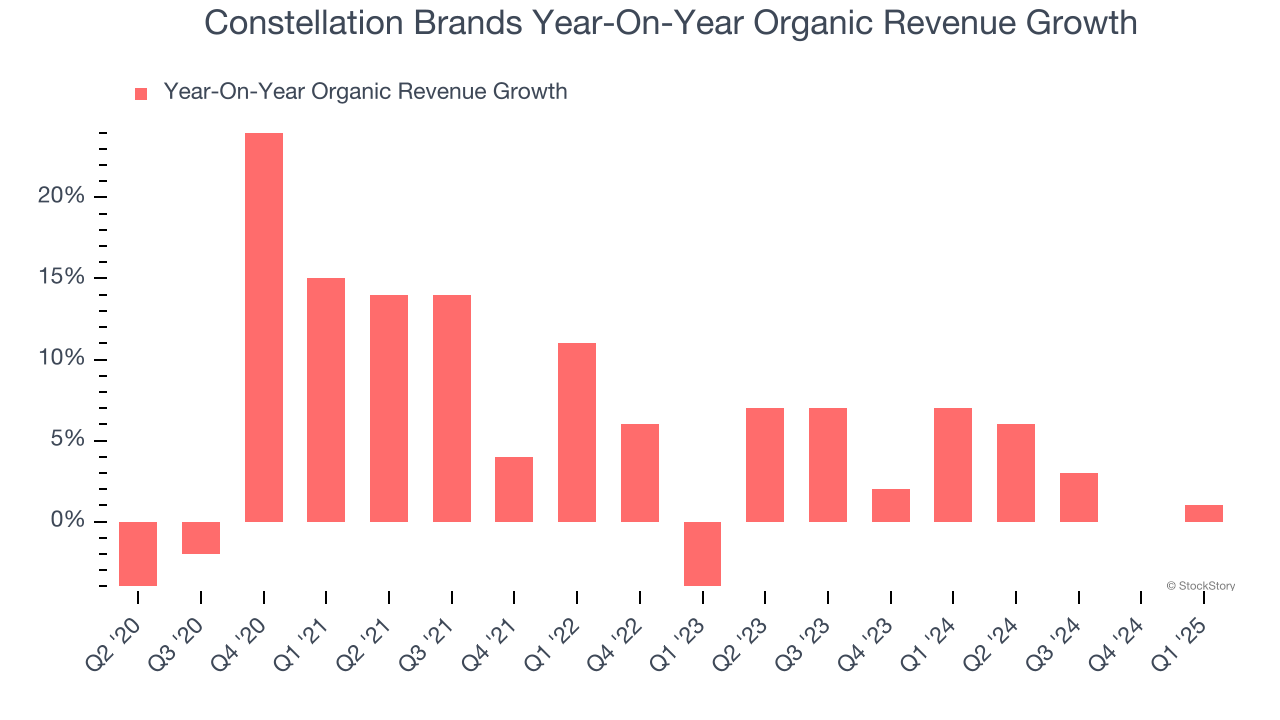
In the latest quarter, Constellation Brands’s organic sales rose by 1% year on year. This was a meaningful deceleration from its historical levels. We’ll be watching closely to see if Constellation Brands can reaccelerate growth.
Key Takeaways from Constellation Brands’s Q1 Results
It was encouraging to see Constellation Brands beat analysts’ gross margin expectations this quarter. We were also happy its EPS outperformed. On the other hand, its EBITDA missed significantly and its full-year EPS guidance fell short of Wall Street’s estimates. Overall, this was a weaker quarter. The stock traded down 3.5% to $177.01 immediately following the results.
Constellation Brands underperformed this quarter, but does that create an opportunity to invest right now? If you’re making that decision, you should consider the bigger picture of valuation, business qualities, as well as the latest earnings. We cover that in our actionable full research report which you can read here, it’s free.


