
Tecnoglass currently trades at $70.28 per share and has shown little upside over the past six months, posting a middling return of 2.6%. However, the stock is beating the S&P 500’s 2.9% decline during that period.
Is TGLS a buy right now? Or is this an overvalued company? Find out in our full research report, it’s free.
Why Are We Positive On TGLS?
The first-ever Colombian company to trade on the NASDAQ, Tecnoglass (NYSE: TGLS) is a manufacturer of architectural glass, windows, and aluminum products.
1. Skyrocketing Revenue Shows Strong Momentum
A company’s long-term performance is an indicator of its overall quality. Any business can have short-term success, but a top-tier one grows for years. Luckily, Tecnoglass’s sales grew at an incredible 15.6% compounded annual growth rate over the last five years. Its growth surpassed the average industrials company and shows its offerings resonate with customers. 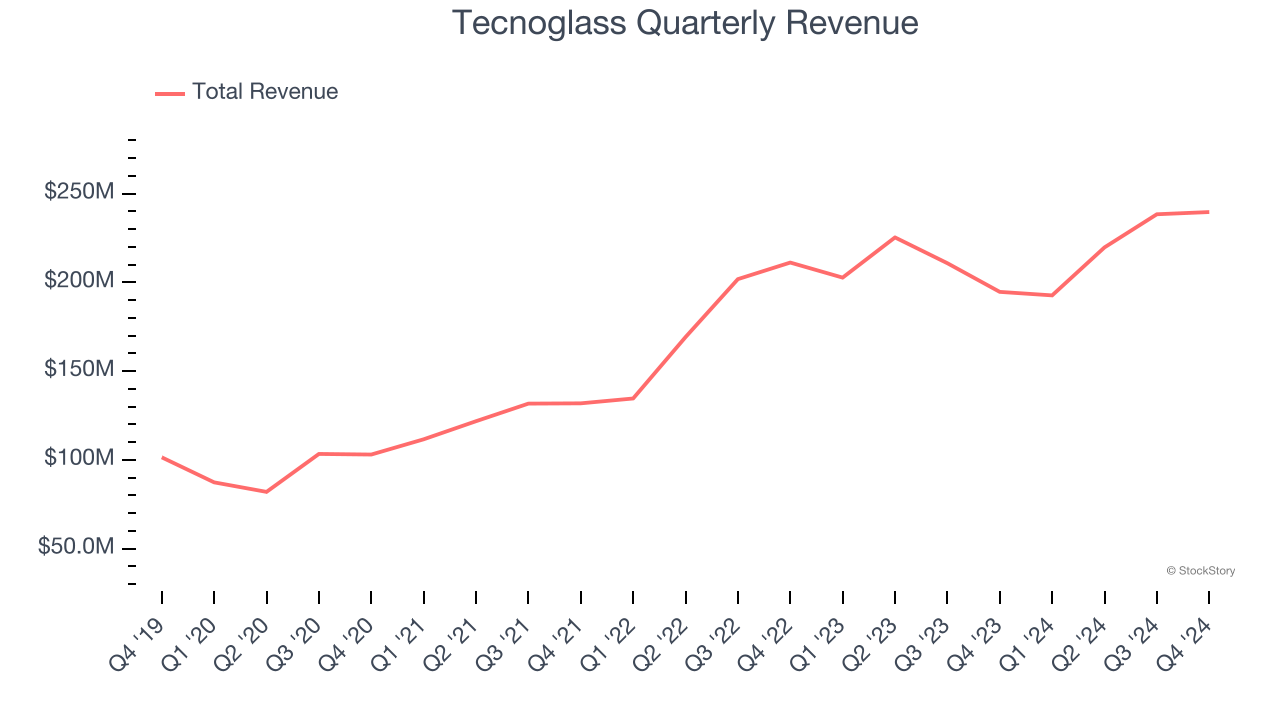
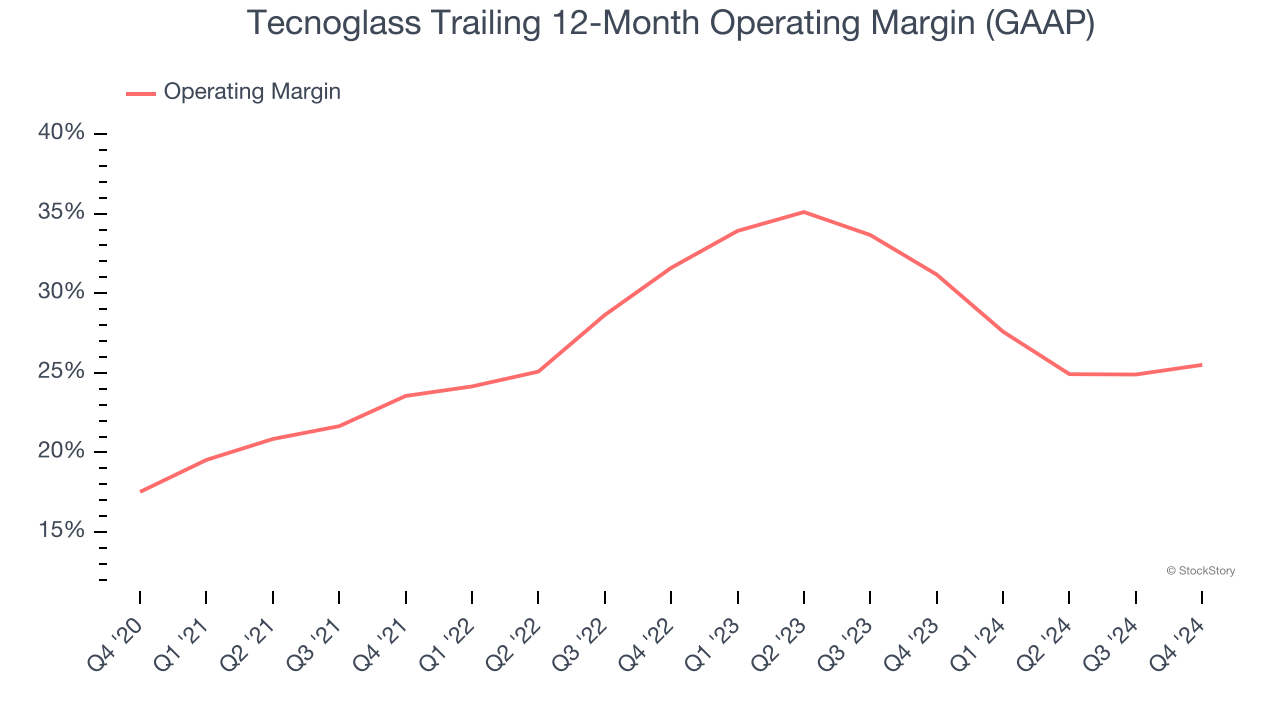
2. Operating Margin Reveals a Well-Run Organization
Operating margin is a key measure of profitability. Think of it as net income - the bottom line - excluding the impact of taxes and interest on debt, which are less connected to business fundamentals.
Tecnoglass has been a well-oiled machine over the last five years. It demonstrated elite profitability for an industrials business, boasting an average operating margin of 27%. This result isn’t surprising as its high gross margin gives it a favorable starting point.
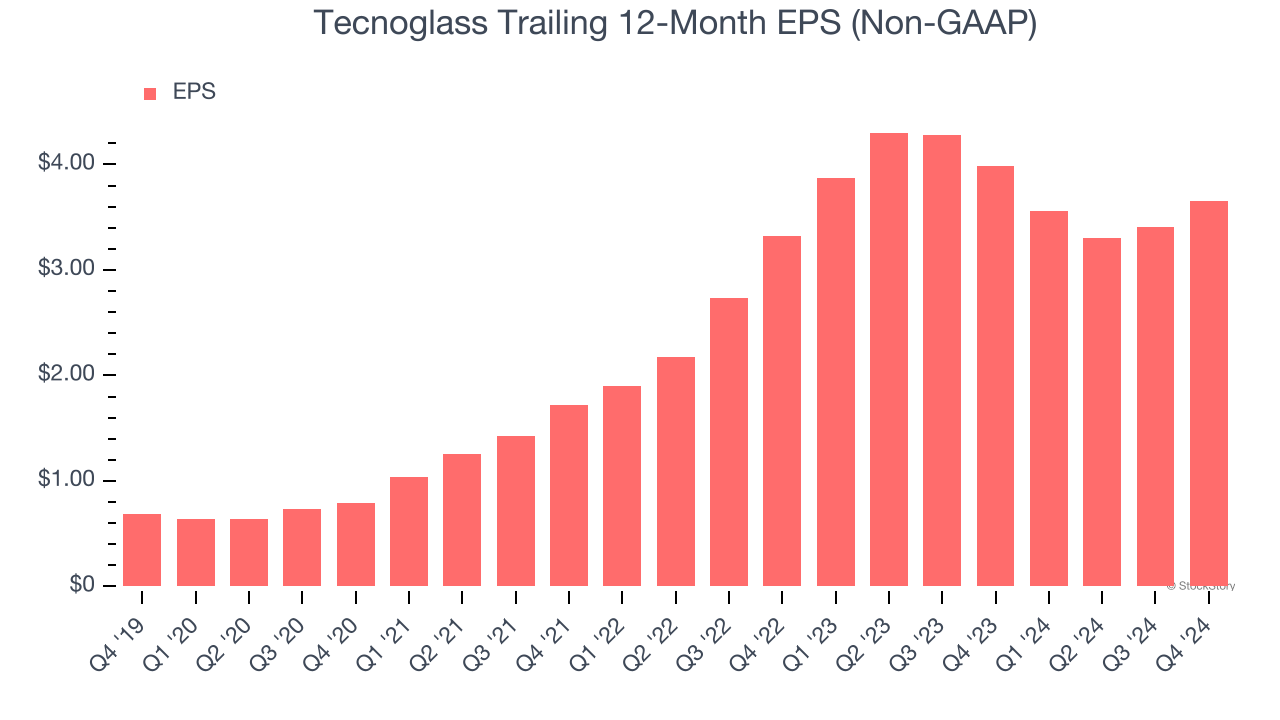
3. Outstanding Long-Term EPS Growth
Analyzing the long-term change in earnings per share (EPS) shows whether a company's incremental sales were profitable – for example, revenue could be inflated through excessive spending on advertising and promotions.
Tecnoglass’s EPS grew at an astounding 39.8% compounded annual growth rate over the last five years, higher than its 15.6% annualized revenue growth. This tells us the company became more profitable on a per-share basis as it expanded.
Final Judgment
These are just a few reasons why we think Tecnoglass is a high-quality business, and with its recent outperformance amid a softer market environment, the stock trades at 16.7× forward price-to-earnings (or $70.28 per share). Is now the time to initiate a position? See for yourself in our comprehensive research report, it’s free.
Stocks We Like Even More Than Tecnoglass
Market indices reached historic highs following Donald Trump’s presidential victory in November 2024, but the outlook for 2025 is clouded by new trade policies that could impact business confidence and growth.
While this has caused many investors to adopt a "fearful" wait-and-see approach, we’re leaning into our best ideas that can grow regardless of the political or macroeconomic climate. Take advantage of Mr. Market by checking out our Top 5 Growth Stocks for this month. This is a curated list of our High Quality stocks that have generated a market-beating return of 175% over the last five years.
Stocks that made our list in 2019 include now familiar names such as Nvidia (+2,183% between December 2019 and December 2024) as well as under-the-radar businesses like Comfort Systems (+751% five-year return). Find your next big winner with StockStory today for free.


