Electronic component manufacturer Belden (NYSE: BDC) reported Q1 CY2025 results exceeding the market’s revenue expectations, with sales up 16.6% year on year to $624.9 million. On the other hand, next quarter’s revenue guidance of $652.5 million was less impressive, coming in 2.1% below analysts’ estimates. Its non-GAAP profit of $1.60 per share was 7.1% above analysts’ consensus estimates.
Is now the time to buy Belden? Find out by accessing our full research report, it’s free.
Belden (BDC) Q1 CY2025 Highlights:
- Revenue: $624.9 million vs analyst estimates of $613.7 million (16.6% year-on-year growth, 1.8% beat)
- Adjusted EPS: $1.60 vs analyst estimates of $1.49 (7.1% beat)
- Adjusted EBITDA: $104 million vs analyst estimates of $99.62 million (16.6% margin, 4.4% beat)
- Revenue Guidance for Q2 CY2025 is $652.5 million at the midpoint, below analyst estimates of $666.3 million
- Adjusted EPS guidance for Q2 CY2025 is $1.72 at the midpoint, below analyst estimates of $1.73
- Operating Margin: 11.6%, up from 9.9% in the same quarter last year
- Free Cash Flow was -$24.76 million compared to -$21.51 million in the same quarter last year
- Market Capitalization: $4.10 billion
“Thanks to the efforts of our team, Belden had a strong start to the year with revenues up 17%, combined with expanding margins,” said Ashish Chand, President and CEO of Belden.
Company Overview
With its enamel-coated copper wire used in WWI for the Allied forces, Belden (NYSE: BDC) designs, manufactures, and sells electronic components to various industries.
Sales Growth
A company’s long-term sales performance can indicate its overall quality. Any business can have short-term success, but a top-tier one grows for years. Regrettably, Belden’s sales grew at a sluggish 4% compounded annual growth rate over the last five years. This fell short of our benchmark for the industrials sector and is a poor baseline for our analysis.
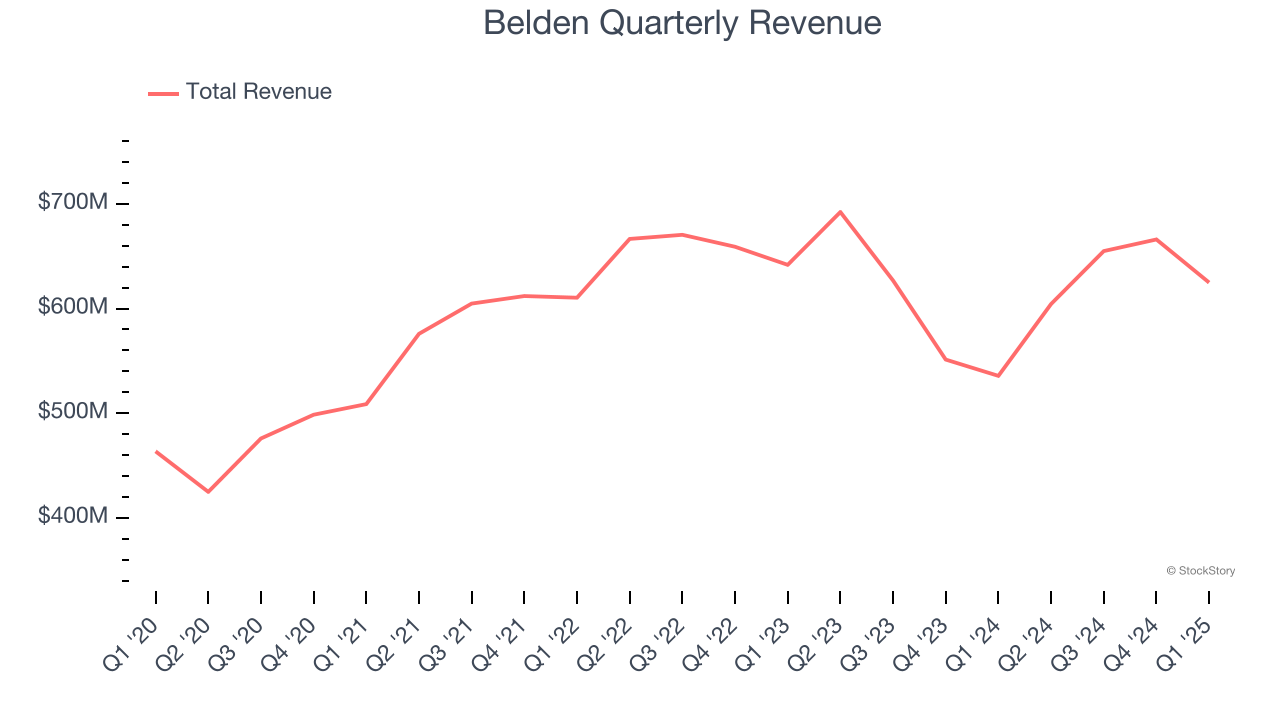
We at StockStory place the most emphasis on long-term growth, but within industrials, a half-decade historical view may miss cycles, industry trends, or a company capitalizing on catalysts such as a new contract win or a successful product line. Belden’s performance shows it grew in the past but relinquished its gains over the last two years, as its revenue fell by 1.7% annually. 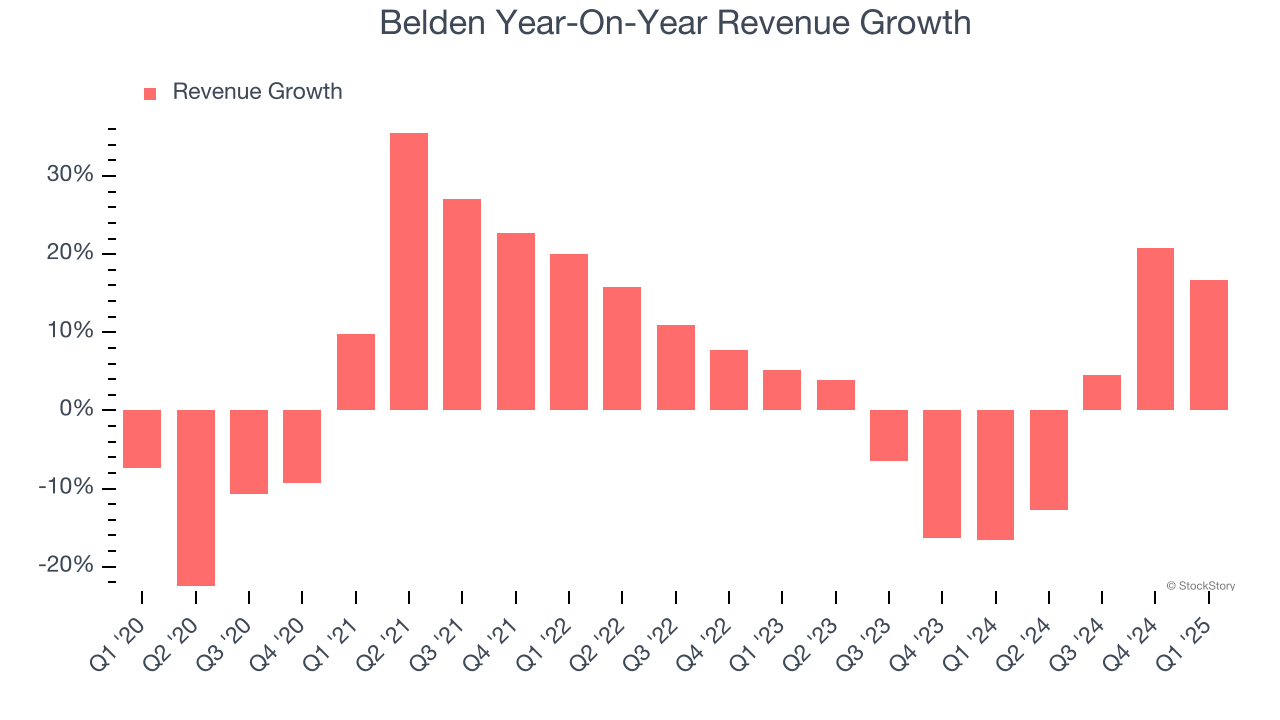
We can dig further into the company’s revenue dynamics by analyzing its most important segments, Enterprise and Industrial, which are 43.9% and 56.1% of revenue. Over the last two years, Belden’s Enterprise revenue (network infrastructure and broadband solutions) averaged 4.7% year-on-year declines. On the other hand, its Industrial revenue (infrastructure digitization and automation) averaged 4.3% growth.
This quarter, Belden reported year-on-year revenue growth of 16.6%, and its $624.9 million of revenue exceeded Wall Street’s estimates by 1.8%. Company management is currently guiding for a 8% year-on-year increase in sales next quarter.
Looking further ahead, sell-side analysts expect revenue to grow 6.8% over the next 12 months. Although this projection implies its newer products and services will catalyze better top-line performance, it is still below average for the sector.
Here at StockStory, we certainly understand the potential of thematic investing. Diverse winners from Microsoft (MSFT) to Alphabet (GOOG), Coca-Cola (KO) to Monster Beverage (MNST) could all have been identified as promising growth stories with a megatrend driving the growth. So, in that spirit, we’ve identified a relatively under-the-radar profitable growth stock benefiting from the rise of AI, available to you FREE via this link.
Operating Margin
Operating margin is one of the best measures of profitability because it tells us how much money a company takes home after procuring and manufacturing its products, marketing and selling those products, and most importantly, keeping them relevant through research and development.
Belden has managed its cost base well over the last five years. It demonstrated solid profitability for an industrials business, producing an average operating margin of 11.6%. This result isn’t surprising as its high gross margin gives it a favorable starting point.
Looking at the trend in its profitability, Belden’s operating margin rose by 3.5 percentage points over the last five years, as its sales growth gave it operating leverage.
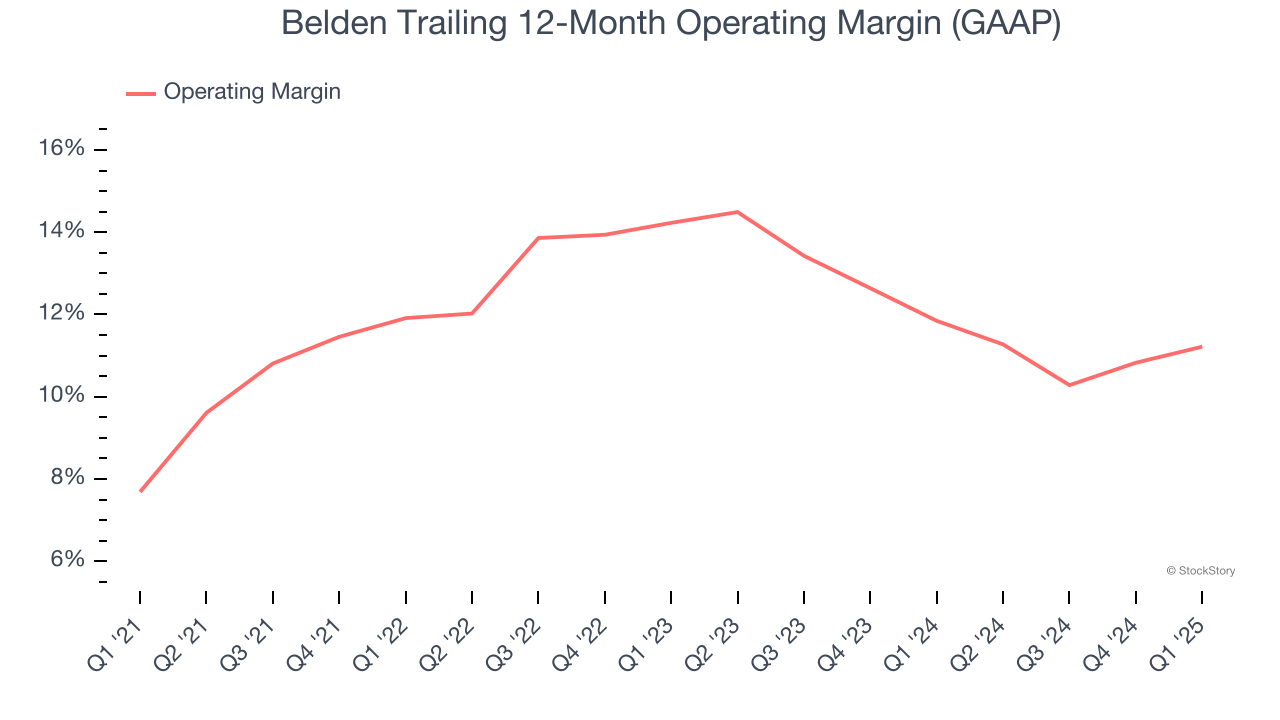
In Q1, Belden generated an operating profit margin of 11.6%, up 1.7 percentage points year on year. The increase was encouraging, and because its operating margin rose more than its gross margin, we can infer it was more efficient with expenses such as marketing, R&D, and administrative overhead.
Earnings Per Share
Revenue trends explain a company’s historical growth, but the long-term change in earnings per share (EPS) points to the profitability of that growth – for example, a company could inflate its sales through excessive spending on advertising and promotions.
Belden’s EPS grew at a decent 9.3% compounded annual growth rate over the last five years, higher than its 4% annualized revenue growth. This tells us the company became more profitable on a per-share basis as it expanded.
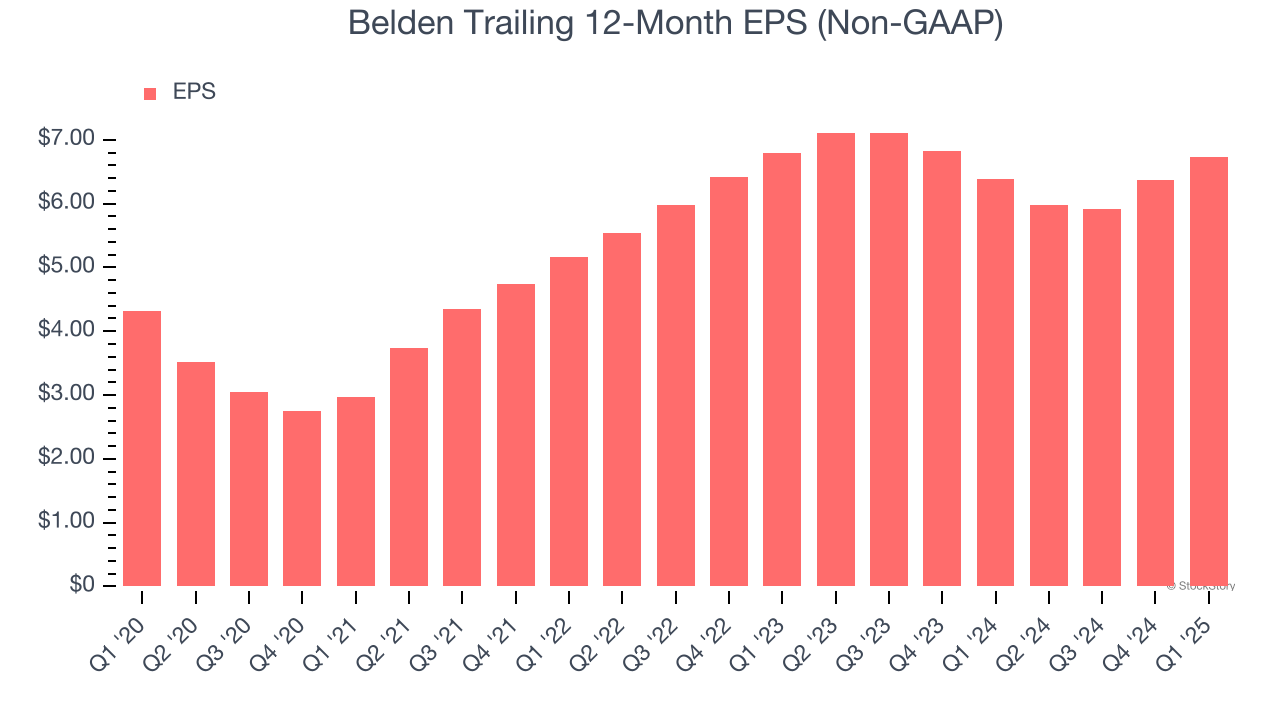
Diving into Belden’s quality of earnings can give us a better understanding of its performance. As we mentioned earlier, Belden’s operating margin expanded by 3.5 percentage points over the last five years. On top of that, its share count shrank by 10.3%. These are positive signs for shareholders because improving profitability and share buybacks turbocharge EPS growth relative to revenue growth. 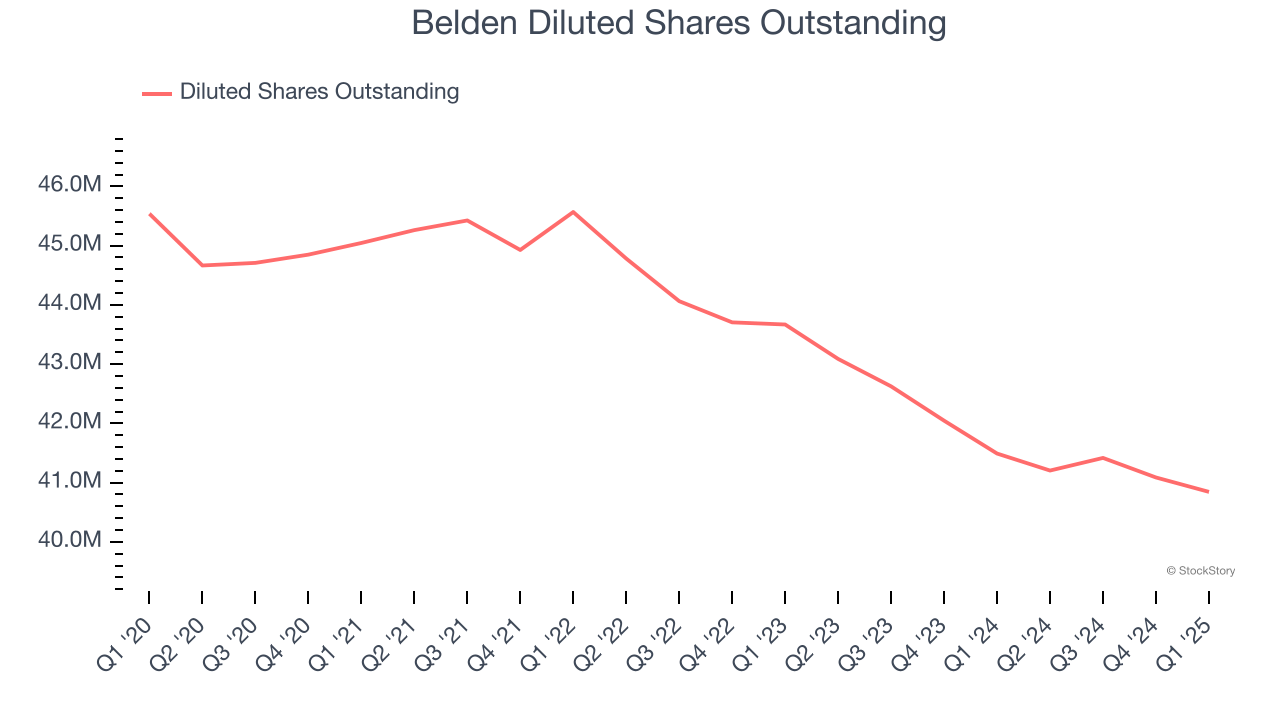
Like with revenue, we analyze EPS over a more recent period because it can provide insight into an emerging theme or development for the business.
For Belden, EPS didn’t budge over the last two years, a regression from its five-year trend. We hope it can revert to earnings growth in the coming years.
In Q1, Belden reported EPS at $1.60, up from $1.24 in the same quarter last year. This print beat analysts’ estimates by 7.1%. Over the next 12 months, Wall Street expects Belden’s full-year EPS of $6.73 to grow 7.8%.
Key Takeaways from Belden’s Q1 Results
We enjoyed seeing Belden beat analysts’ revenue, EPS, and EBITDA expectations this quarter. On the other hand, its quarterly revenue and EPS guidance fell short of Wall Street’s estimates. Overall, this print was mixed but still had some key positives. The market seemed to be hoping for more, and the stock traded down 3.4% to $99.58 immediately after reporting.
So should you invest in Belden right now? The latest quarter does matter, but not nearly as much as longer-term fundamentals and valuation, when deciding if the stock is a buy. We cover that in our actionable full research report which you can read here, it’s free.