Outerwear manufacturer Columbia Sportswear (NASDAQ: COLM) beat Wall Street’s revenue expectations in Q1 CY2025, with sales up 1.1% year on year to $778.5 million. On the other hand, next quarter’s revenue guidance of $587.5 million was less impressive, coming in 2.9% below analysts’ estimates. Its GAAP profit of $0.75 per share was 9.7% above analysts’ consensus estimates.
Is now the time to buy Columbia Sportswear? Find out by accessing our full research report, it’s free.
Columbia Sportswear (COLM) Q1 CY2025 Highlights:
- Revenue: $778.5 million vs analyst estimates of $756.9 million (1.1% year-on-year growth, 2.9% beat)
- EPS (GAAP): $0.75 vs analyst estimates of $0.68 (9.7% beat)
- Adjusted EBITDA: $65.2 million vs analyst estimates of $76.45 million (8.4% margin, 14.7% miss)
- Revenue Guidance for Q2 CY2025 is $587.5 million at the midpoint, below analyst estimates of $605 million
- Operating Margin: 6%, in line with the same quarter last year
- Free Cash Flow was -$47.6 million, down from $91.98 million in the same quarter last year
- Market Capitalization: $3.43 billion
Chairman, President and Chief Executive Officer Tim Boyle commented, “I’m encouraged by our first quarter results, with net sales and earnings exceeding our guidance range. We generated healthy growth in nearly all our international markets, including double-digit percent growth in the LAAP region and high-single-digit percent constant currency growth in the EMEA region.
Company Overview
Originally founded as a hat store in 1938, Columbia Sportswear (NASDAQ: COLM) is a manufacturer of outerwear, sportswear, and footwear designed for outdoor enthusiasts.
Sales Growth
A company’s long-term performance is an indicator of its overall quality. Even a bad business can shine for one or two quarters, but a top-tier one grows for years. Unfortunately, Columbia Sportswear’s 2.7% annualized revenue growth over the last five years was weak. This was below our standards and is a tough starting point for our analysis.
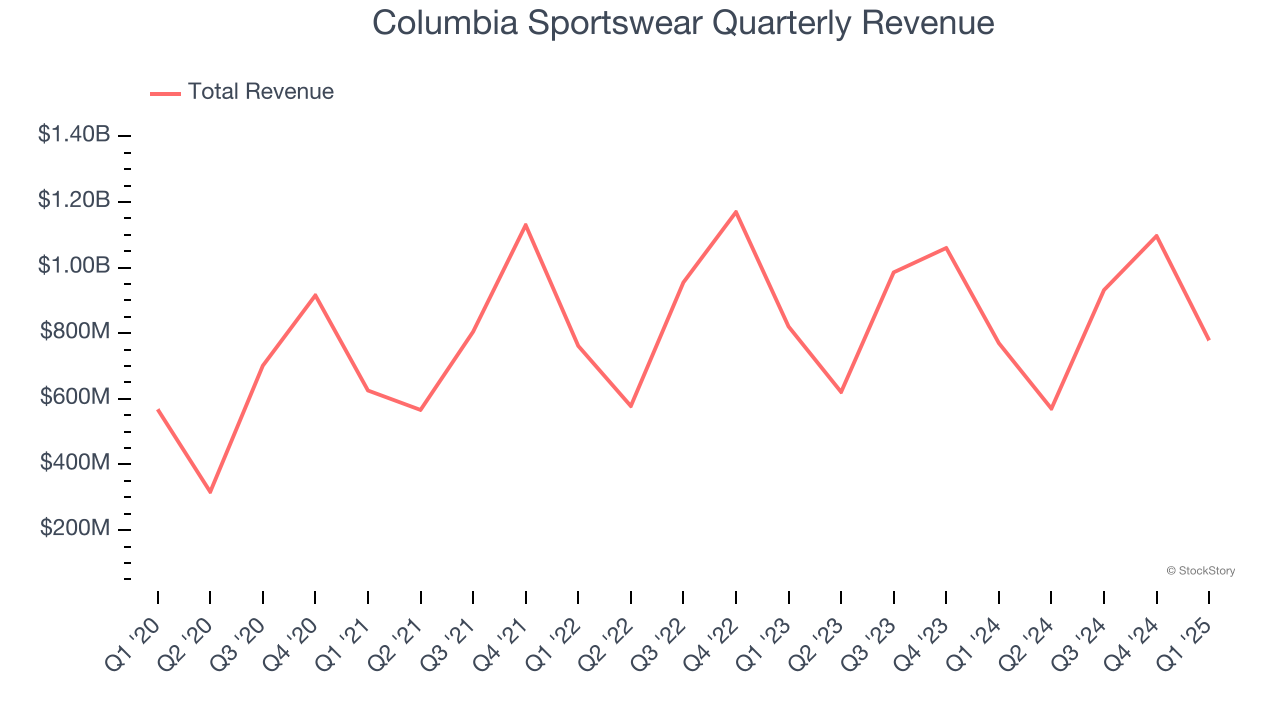
Long-term growth is the most important, but within consumer discretionary, product cycles are short and revenue can be hit-driven due to rapidly changing trends and consumer preferences. Columbia Sportswear’s performance shows it grew in the past but relinquished its gains over the last two years, as its revenue fell by 2.1% annually. 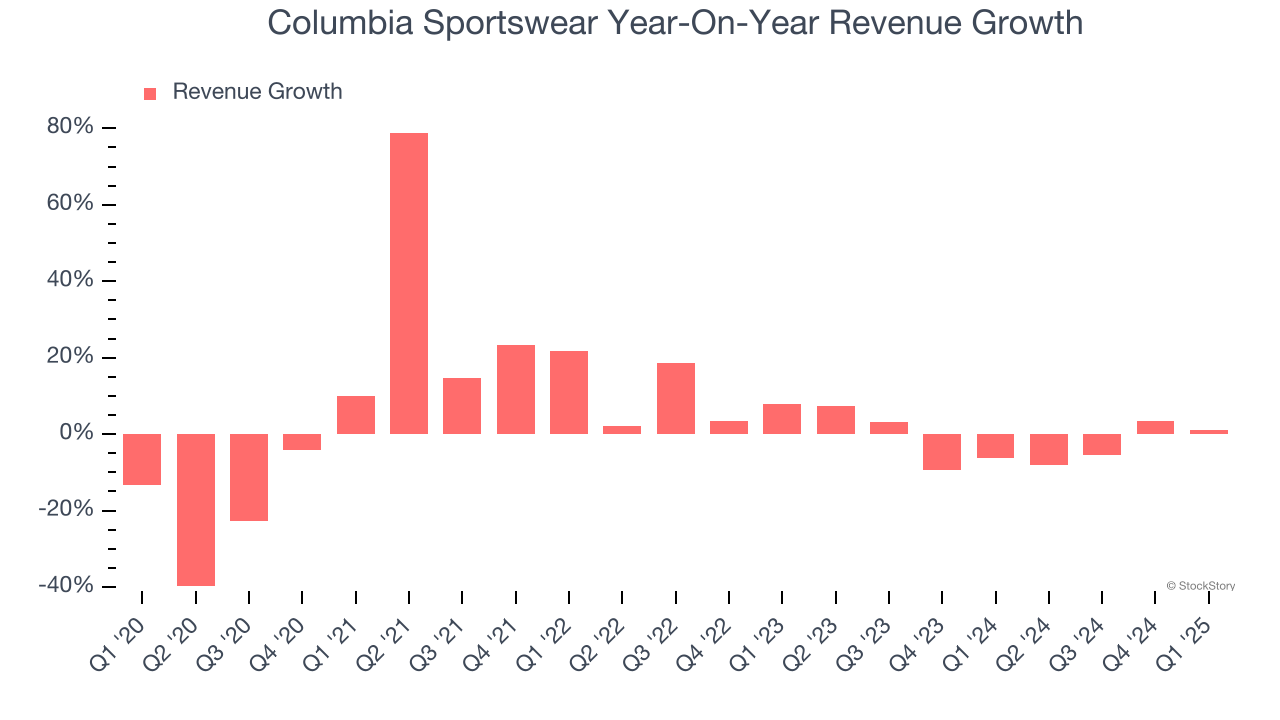
This quarter, Columbia Sportswear reported modest year-on-year revenue growth of 1.1% but beat Wall Street’s estimates by 2.9%. Company management is currently guiding for a 3% year-on-year increase in sales next quarter.
Looking further ahead, sell-side analysts expect revenue to grow 2.1% over the next 12 months. Although this projection indicates its newer products and services will catalyze better top-line performance, it is still below the sector average.
Software is eating the world and there is virtually no industry left that has been untouched by it. That drives increasing demand for tools helping software developers do their jobs, whether it be monitoring critical cloud infrastructure, integrating audio and video functionality, or ensuring smooth content streaming. Click here to access a free report on our 3 favorite stocks to play this generational megatrend.
Operating Margin
Operating margin is a key measure of profitability. Think of it as net income - the bottom line - excluding the impact of taxes and interest on debt, which are less connected to business fundamentals.
Columbia Sportswear’s operating margin might fluctuated slightly over the last 12 months but has generally stayed the same, averaging 8.4% over the last two years. This profitability was mediocre for a consumer discretionary business and caused by its suboptimal cost structure.
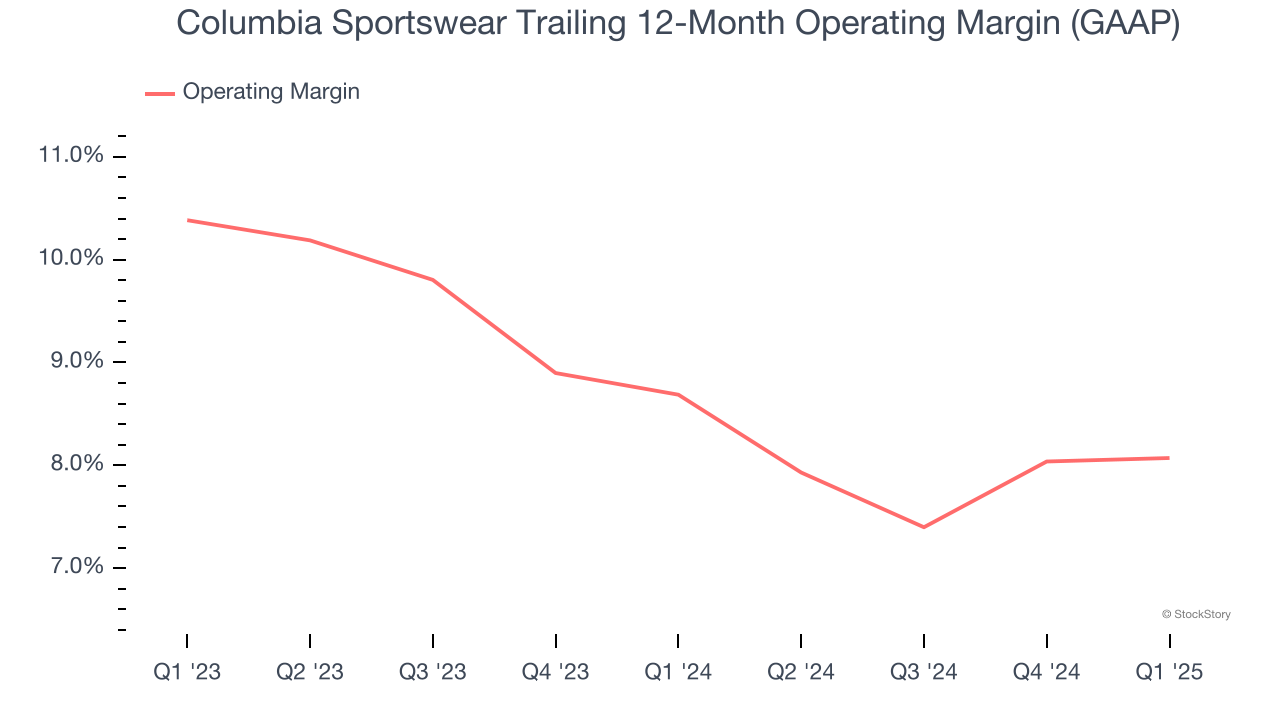
In Q1, Columbia Sportswear generated an operating profit margin of 6%, in line with the same quarter last year. This indicates the company’s overall cost structure has been relatively stable.
Earnings Per Share
Revenue trends explain a company’s historical growth, but the long-term change in earnings per share (EPS) points to the profitability of that growth – for example, a company could inflate its sales through excessive spending on advertising and promotions.
Columbia Sportswear’s flat EPS over the last five years was below its 2.7% annualized revenue growth. We can see the difference stemmed from higher interest expenses or taxes as the company actually grew its operating margin and repurchased its shares during this time.
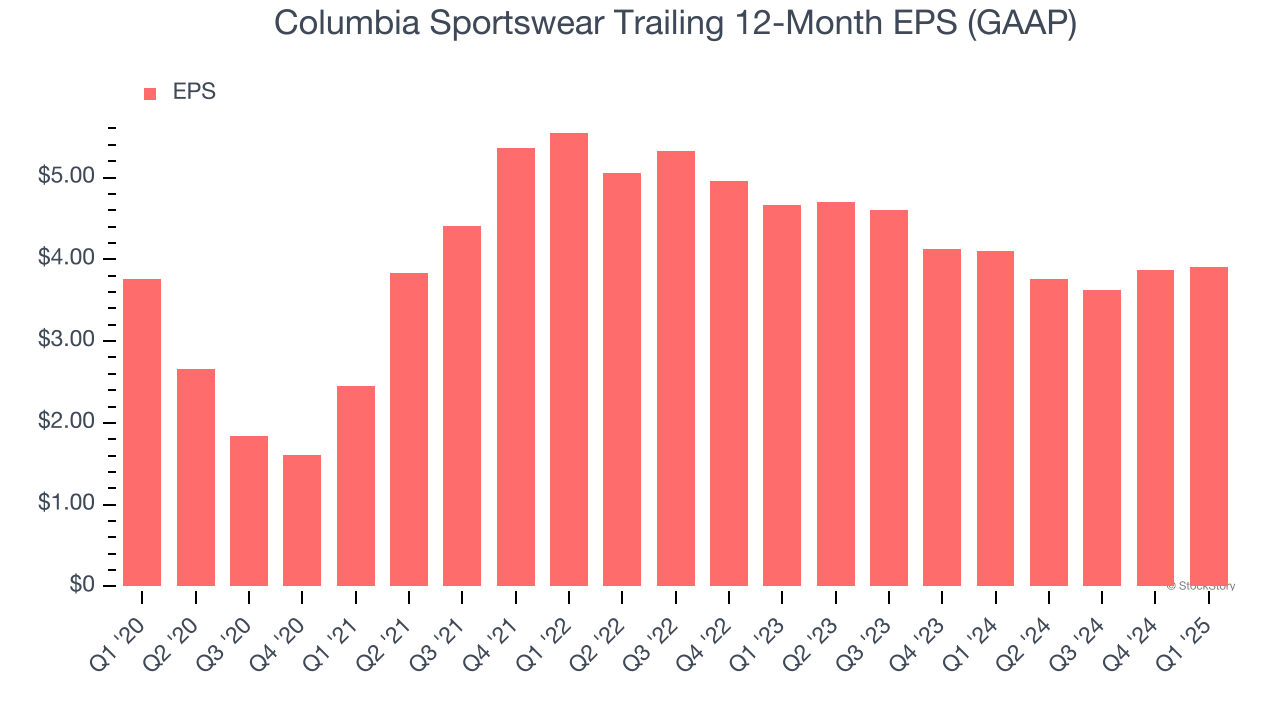
In Q1, Columbia Sportswear reported EPS at $0.75, up from $0.71 in the same quarter last year. This print beat analysts’ estimates by 9.7%. Over the next 12 months, Wall Street expects Columbia Sportswear’s full-year EPS of $3.91 to stay about the same.
Key Takeaways from Columbia Sportswear’s Q1 Results
It was encouraging to see Columbia Sportswear beat analysts’ revenue and EPS expectations this quarter. On the other hand, its EBITDA missed and its revenue guidance for next quarter fell short of Wall Street’s estimates. Overall, this was a weaker quarter. The stock traded down 2% to $61.00 immediately following the results.
Should you buy the stock or not? When making that decision, it’s important to consider its valuation, business qualities, as well as what has happened in the latest quarter. We cover that in our actionable full research report which you can read here, it’s free.