
Business data analytics company Dun & Bradstreet (NYSE: DNB) met Wall Street’s revenue expectations in Q1 CY2025, with sales up 2.7% year on year to $579.8 million. Its non-GAAP profit of $0.21 per share was 5.2% above analysts’ consensus estimates.
Is now the time to buy Dun & Bradstreet? Find out by accessing our full research report, it’s free.
Dun & Bradstreet (DNB) Q1 CY2025 Highlights:
- Revenue: $579.8 million vs analyst estimates of $577.7 million (2.7% year-on-year growth, in line)
- Adjusted EPS: $0.21 vs analyst estimates of $0.20 (5.2% beat)
- Adjusted EBITDA: $210.9 million vs analyst estimates of $206.1 million (36.4% margin, 2.3% beat)
- Operating Margin: 6.1%, up from 2.9% in the same quarter last year
- Free Cash Flow Margin: 15.6%, down from 27.9% in the same quarter last year
- Market Capitalization: $3.99 billion
“We are pleased with our solid start to the year as we delivered 3.6% organic revenue growth, expanded our Adjusted EBITDA margin by 70 basis points, grew adjusted Net Earnings by 6.9%, generated strong cash flow conversion and reduced our net leverage ratio to 3.5 times. We continued to see strong demand for both our Finance & Risk and Sales & Marketing solutions in both North America and International,” said Anthony Jabbour, Dun & Bradstreet Chief Executive Officer.
Company Overview
Known for its proprietary D-U-N-S Number that serves as a unique identifier for businesses worldwide, Dun & Bradstreet (NYSE: DNB) provides business decisioning data and analytics that help companies evaluate credit risks, verify suppliers, enhance sales productivity, and gain market visibility.
Sales Growth
A company’s long-term performance is an indicator of its overall quality. Even a bad business can shine for one or two quarters, but a top-tier one grows for years.
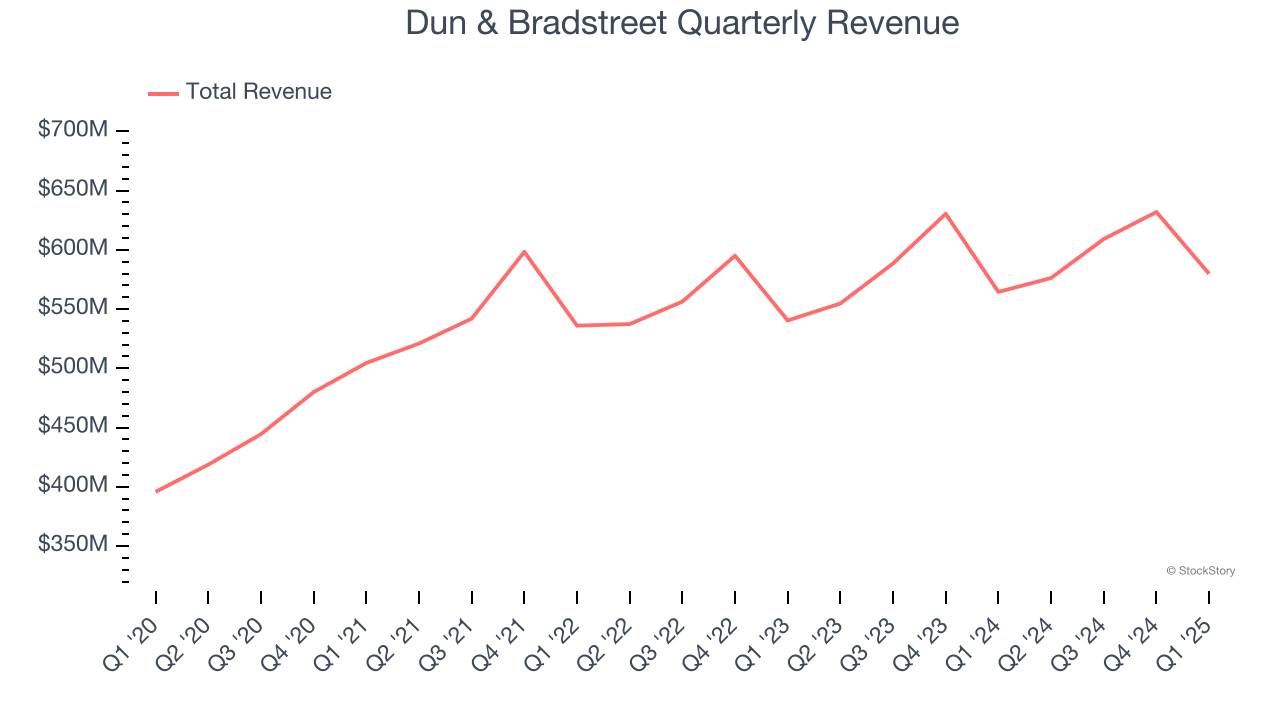
With $2.40 billion in revenue over the past 12 months, Dun & Bradstreet is a mid-sized business services company, which sometimes brings disadvantages compared to larger competitors benefiting from better economies of scale. On the bright side, it can still flex high growth rates because it’s working from a smaller revenue base.
As you can see below, Dun & Bradstreet grew its sales at a solid 7.9% compounded annual growth rate over the last five years. This shows it had high demand, a useful starting point for our analysis.
We at StockStory place the most emphasis on long-term growth, but within business services, a half-decade historical view may miss recent innovations or disruptive industry trends. Dun & Bradstreet’s recent performance shows its demand has slowed as its annualized revenue growth of 3.7% over the last two years was below its five-year trend. 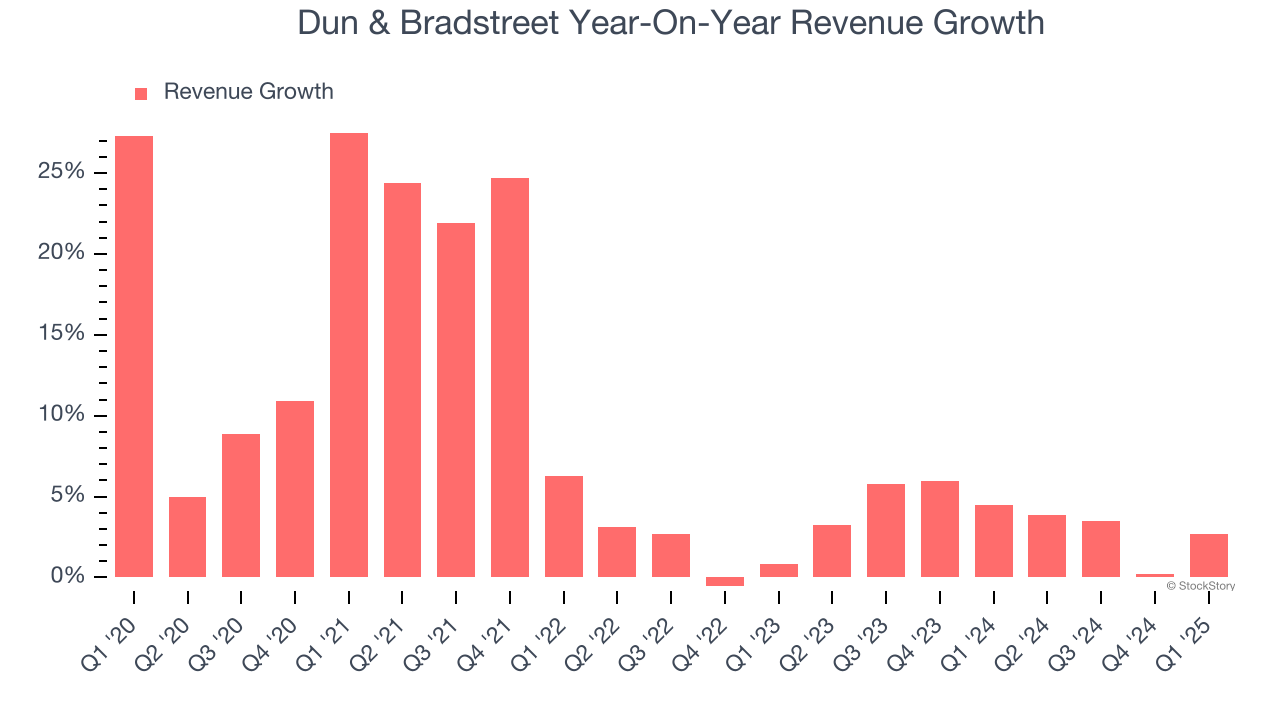
This quarter, Dun & Bradstreet grew its revenue by 2.7% year on year, and its $579.8 million of revenue was in line with Wall Street’s estimates.
Looking ahead, sell-side analysts expect revenue to grow 3.9% over the next 12 months, similar to its two-year rate. This projection doesn't excite us and indicates its newer products and services will not accelerate its top-line performance yet.
Here at StockStory, we certainly understand the potential of thematic investing. Diverse winners from Microsoft (MSFT) to Alphabet (GOOG), Coca-Cola (KO) to Monster Beverage (MNST) could all have been identified as promising growth stories with a megatrend driving the growth. So, in that spirit, we’ve identified a relatively under-the-radar profitable growth stock benefiting from the rise of AI, available to you FREE via this link.
Operating Margin
Dun & Bradstreet was profitable over the last five years but held back by its large cost base. Its average operating margin of 6.6% was weak for a business services business.
On the plus side, Dun & Bradstreet’s operating margin rose by 5.1 percentage points over the last five years, as its sales growth gave it immense operating leverage.
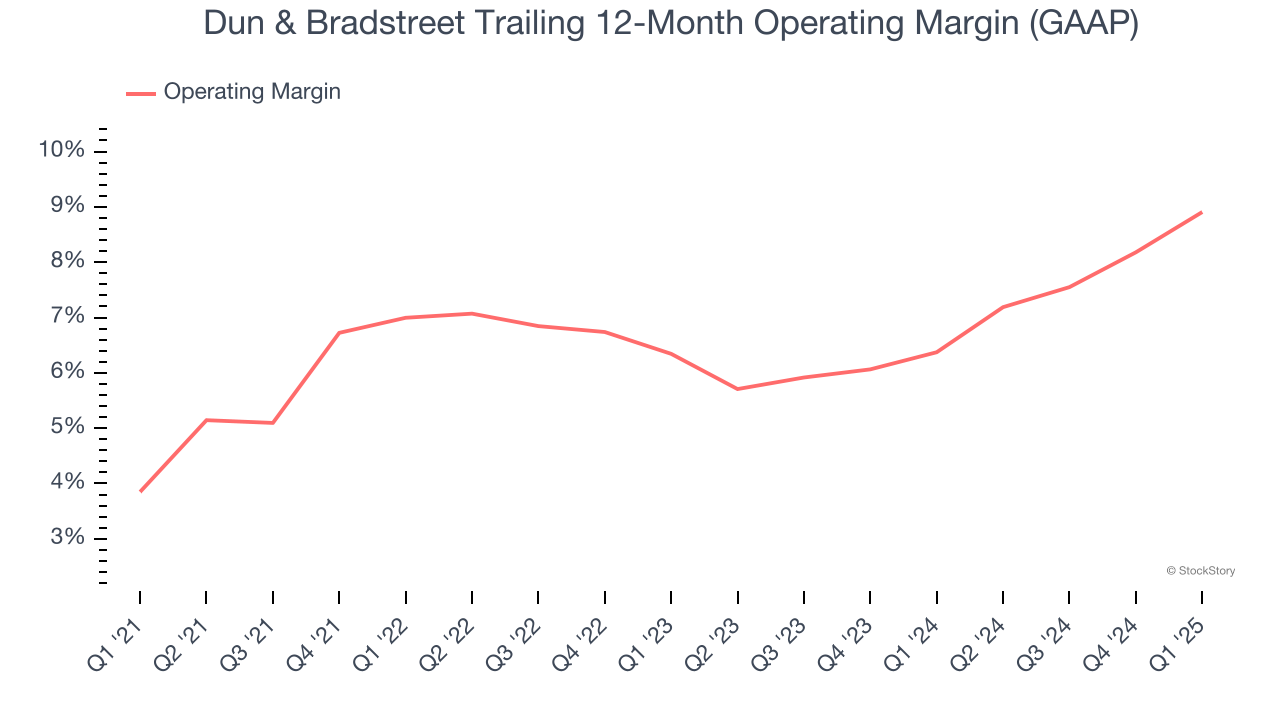
In Q1, Dun & Bradstreet generated an operating profit margin of 6.1%, up 3.1 percentage points year on year. This increase was a welcome development and shows it was more efficient.
Earnings Per Share
Revenue trends explain a company’s historical growth, but the long-term change in earnings per share (EPS) points to the profitability of that growth – for example, a company could inflate its sales through excessive spending on advertising and promotions.
Dun & Bradstreet’s EPS grew at an astounding 24.9% compounded annual growth rate over the last five years, higher than its 7.9% annualized revenue growth. This tells us the company became more profitable on a per-share basis as it expanded.
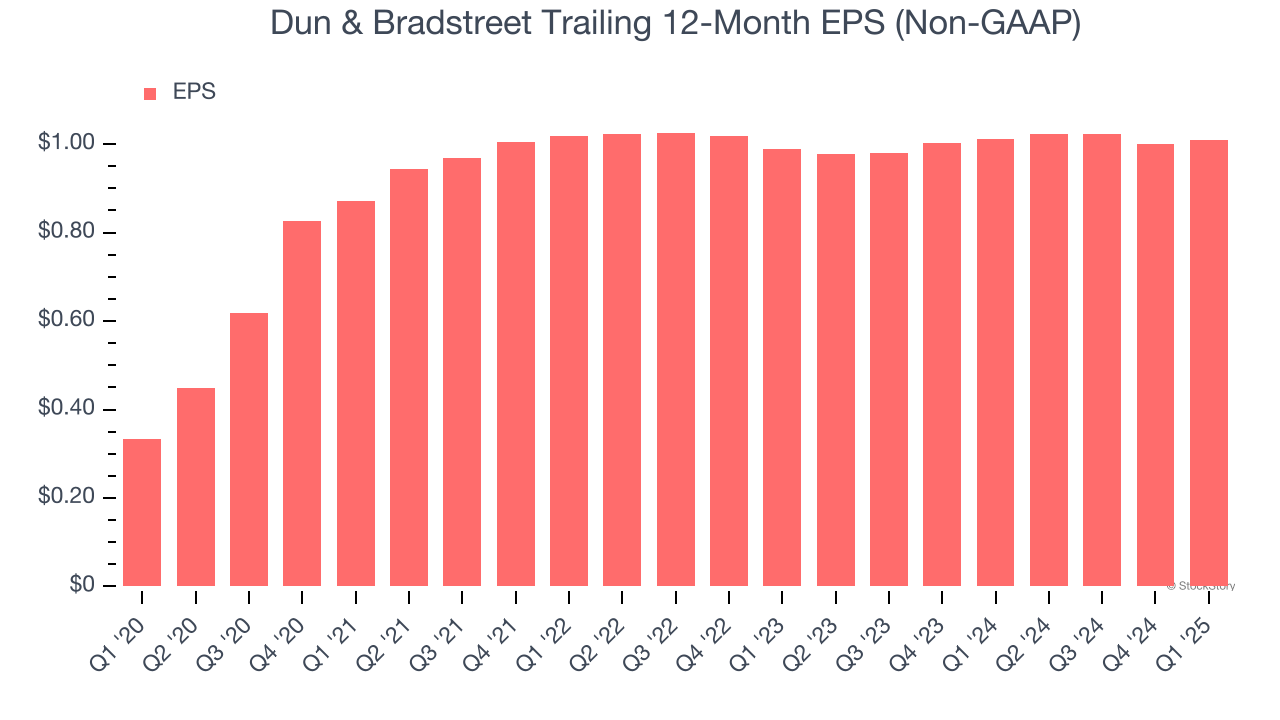
Diving into the nuances of Dun & Bradstreet’s earnings can give us a better understanding of its performance. As we mentioned earlier, Dun & Bradstreet’s operating margin expanded by 5.1 percentage points over the last five years. This was the most relevant factor (aside from the revenue impact) behind its higher earnings; taxes and interest expenses can also affect EPS but don’t tell us as much about a company’s fundamentals.
In Q1, Dun & Bradstreet reported EPS at $0.21, in line with the same quarter last year. This print beat analysts’ estimates by 5.2%. Over the next 12 months, Wall Street expects Dun & Bradstreet’s full-year EPS of $1.01 to grow 5.8%.
Key Takeaways from Dun & Bradstreet’s Q1 Results
It was encouraging to see Dun & Bradstreet beat analysts’ EPS and EBITDA expectations this quarter. Overall, this print had some key positives. The stock remained flat at $8.98 immediately following the results.
Dun & Bradstreet put up rock-solid earnings, but one quarter doesn’t necessarily make the stock a buy. Let’s see if this is a good investment. The latest quarter does matter, but not nearly as much as longer-term fundamentals and valuation, when deciding if the stock is a buy. We cover that in our actionable full research report which you can read here, it’s free.


