
Packaged foods company Kellanova (NYSE: K) fell short of the market’s revenue expectations in Q1 CY2025, with sales falling 3.7% year on year to $3.08 billion. Its non-GAAP profit of $0.90 per share was 11.1% below analysts’ consensus estimates.
Is now the time to buy Kellanova? Find out by accessing our full research report, it’s free.
Kellanova (K) Q1 CY2025 Highlights:
- Revenue: $3.08 billion vs analyst estimates of $3.15 billion (3.7% year-on-year decline, 2% miss)
- Adjusted EPS: $0.90 vs analyst expectations of $1.01 (11.1% miss)
- Adjusted EBITDA: $522 million vs analyst estimates of $597.5 million (16.9% margin, 12.6% miss)
- Operating Margin: 13.9%, up from 12.3% in the same quarter last year
- Free Cash Flow was -$60 million, down from $209 million in the same quarter last year
- Organic Revenue was flat year on year (5.4% in the same quarter last year)
- Sales Volumes fell 2.5% year on year, in line with the same quarter last year
- Market Capitalization: $28.57 billion
Company Overview
With Corn Flakes as its first and most iconic product, Kellanova (NYSE: K) is a packaged foods company that is dominant in the cereal and snack categories.
Sales Growth
A company’s long-term sales performance can indicate its overall quality. Any business can have short-term success, but a top-tier one grows for years.
With $12.63 billion in revenue over the past 12 months, Kellanova is one of the larger consumer staples companies and benefits from a well-known brand that influences purchasing decisions. However, its scale is a double-edged sword because there are only a finite number of major retail partners, placing a ceiling on its growth. For Kellanova to boost its sales, it likely needs to adjust its prices, launch new offerings, or lean into foreign markets.
As you can see below, Kellanova’s demand was weak over the last three years. Its sales fell by 2.6% annually as consumers bought less of its products.
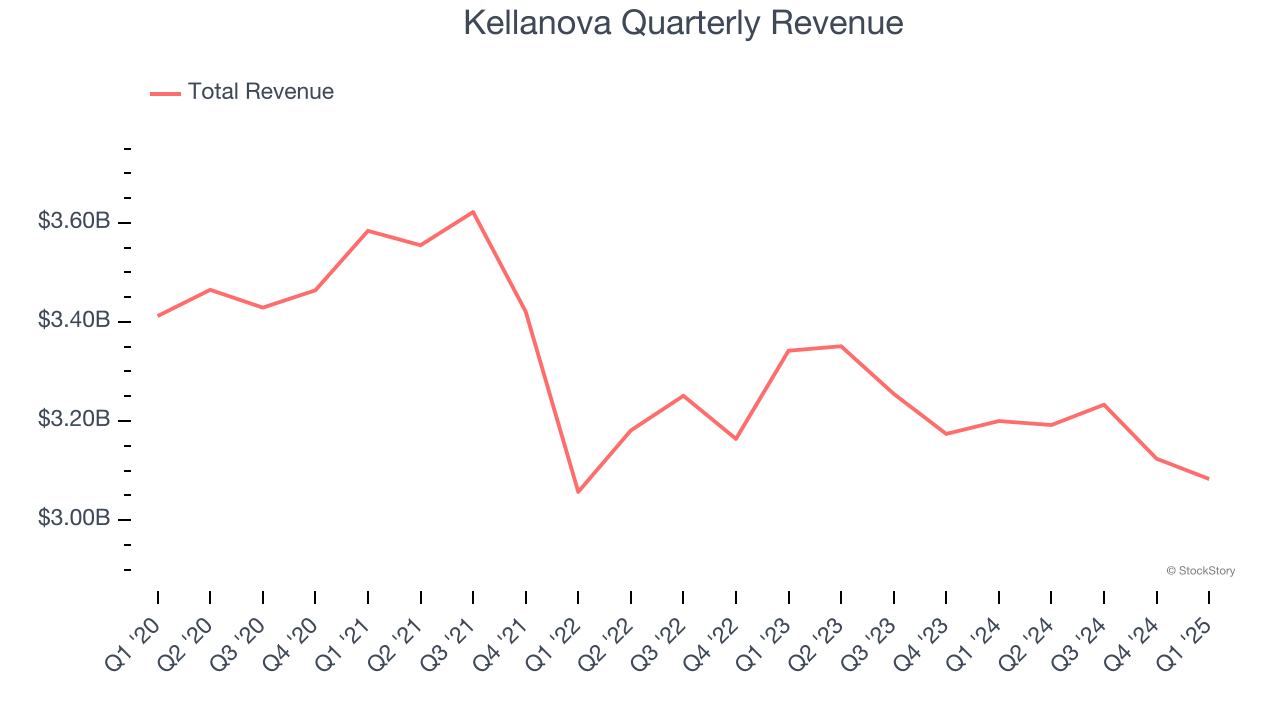
This quarter, Kellanova missed Wall Street’s estimates and reported a rather uninspiring 3.7% year-on-year revenue decline, generating $3.08 billion of revenue.
Looking ahead, sell-side analysts expect revenue to grow 2.2% over the next 12 months. While this projection implies its newer products will spur better top-line performance, it is still below the sector average.
Unless you’ve been living under a rock, it should be obvious by now that generative AI is going to have a huge impact on how large corporations do business. While Nvidia and AMD are trading close to all-time highs, we prefer a lesser-known (but still profitable) stock benefiting from the rise of AI. Click here to access our free report one of our favorites growth stories.
Volume Growth
Revenue growth can be broken down into changes in price and volume (the number of units sold). While both are important, volume is the lifeblood of a successful staples business as there’s a ceiling to what consumers will pay for everyday goods; they can always trade down to non-branded products if the branded versions are too expensive.
To analyze whether Kellanova generated its growth from changes in price or volume, we can compare its volume growth to its organic revenue growth, which excludes non-fundamental impacts on company financials like mergers and currency fluctuations.
Over the last two years, Kellanova’s average quarterly sales volumes have shrunk by 2.9%. This decrease isn’t ideal as the quantity demanded for consumer staples products is typically stable. Luckily, Kellanova was able to offset fewer customers purchasing its products by charging higher prices, enabling it to generate 5.1% average organic revenue growth. We hope the company can grow its volumes soon, however, as consistent price increases (on top of inflation) aren’t sustainable over the long term unless the business is really really special.
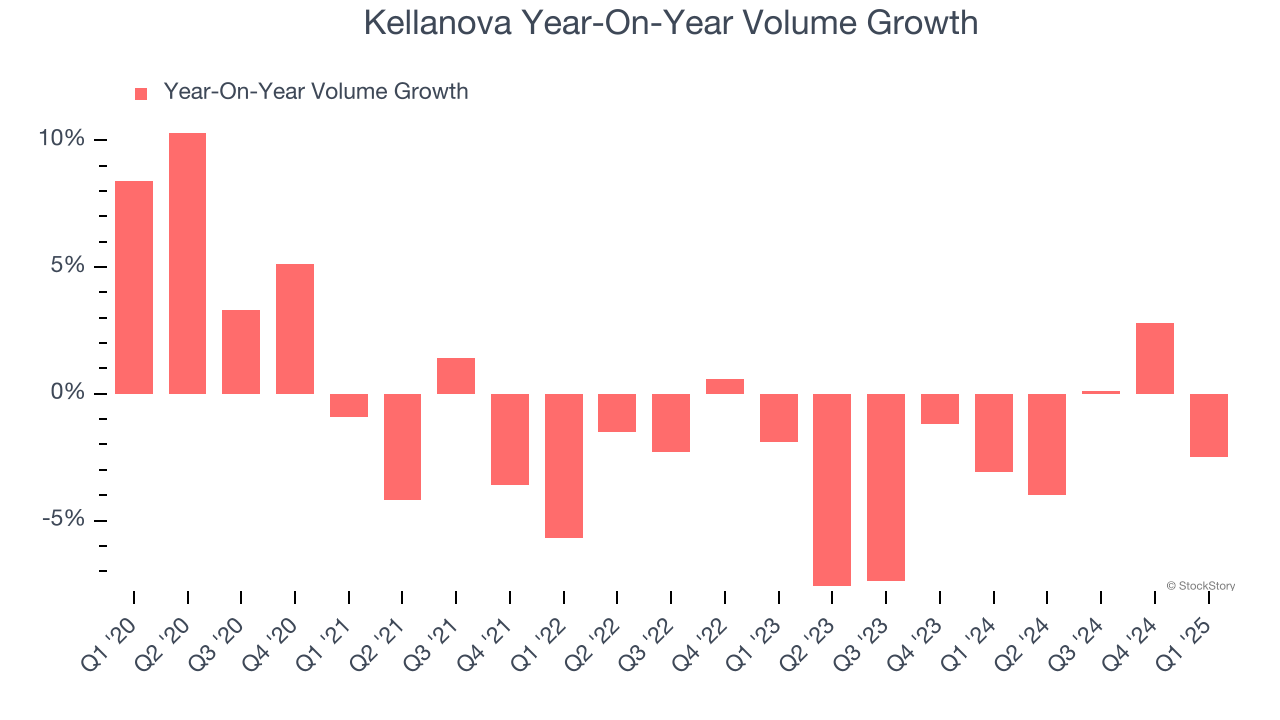
In Kellanova’s Q1 2025, sales volumes dropped 2.5% year on year. This result represents a further deceleration from its historical levels, showing the business is struggling to move its products.
Key Takeaways from Kellanova’s Q1 Results
We struggled to find many positives in these results as its revenue, EPS, and EBITDA missed. Overall, this was a softer quarter. The stock remained flat at $82.80 immediately following the results.
Should you buy the stock or not? We think that the latest quarter is only one piece of the longer-term business quality puzzle. Quality, when combined with valuation, can help determine if the stock is a buy. We cover that in our actionable full research report which you can read here, it’s free.


