Industrial manufacturer Standex (NYSE: SXI) reported Q1 CY2025 results exceeding the market’s revenue expectations, with sales up 17.2% year on year to $207.8 million. Its non-GAAP profit of $1.95 per share was 1.5% above analysts’ consensus estimates.
Is now the time to buy Standex? Find out by accessing our full research report, it’s free.
Standex (SXI) Q1 CY2025 Highlights:
- Revenue: $207.8 million vs analyst estimates of $204.2 million (17.2% year-on-year growth, 1.7% beat)
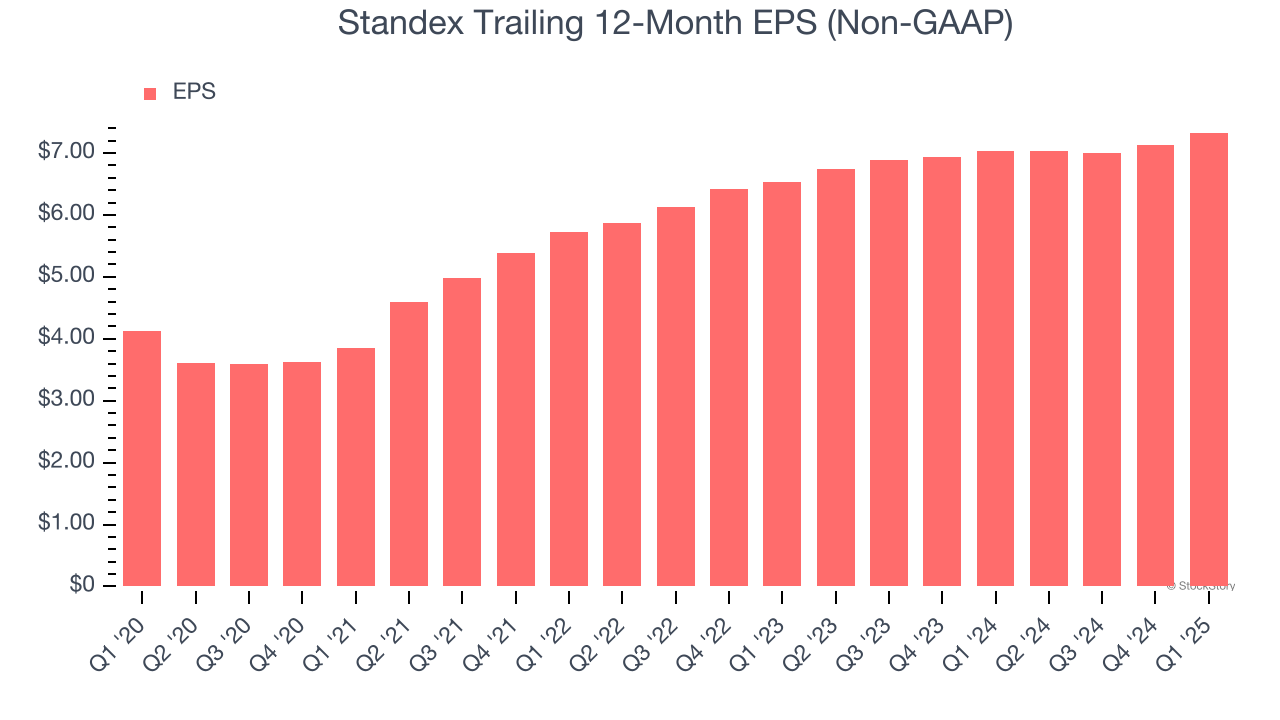
- Adjusted EPS: $1.95 vs analyst estimates of $1.92 (1.5% beat)
- Adjusted EBITDA: $45.3 million vs analyst estimates of $45.64 million (21.8% margin, 0.8% miss)
- Operating Margin: 12.6%, down from 14.9% in the same quarter last year
- Free Cash Flow Margin: 4.6%, down from 10.8% in the same quarter last year
- Market Capitalization: $1.68 billion
Commenting on the quarter's results, President and Chief Executive Officer David Dunbar said, "Following strong operating performance in the fiscal second quarter, we achieved several new records in our fiscal third quarter: record sales since the divestment of the Refrigeration business in April 2020, record adjusted gross margin of 42.3%, and record adjusted operating margin of 19.4%. These results reflect the continued solid operational performance from core businesses, a full quarter of ownership of the fast-growing Amran/Narayan group, and contribution from the recent McStarlite acquisition. Our fast growth market sales totaled $60.4 million or approximately 29% of total sales and are well on track to our expectations for the fiscal year of approximately $170 million. We remain confident about the Company's exposure to positive secular trends in electrical grid, electric and hybrid vehicles, renewable energy, commercialization of space, and defense, and we are reaffirming our long-term target for fast growth market sales of $340 million plus by fiscal year 2028. In addition, we launched three additional new products in the fiscal third quarter totaling 13 year-to-date, achieving our previously committed target of over a dozen and delivering more than 2% of incremental sales."
Company Overview
Holding over 500 patents globally, Standex (NYSE: SXI) is a manufacturer and distributor of industrial components for various sectors.
Sales Growth
Reviewing a company’s long-term sales performance reveals insights into its quality. Any business can put up a good quarter or two, but the best consistently grow over the long haul. Over the last five years, Standex grew its sales at a sluggish 3.4% compounded annual growth rate. This fell short of our benchmark for the industrials sector and is a poor baseline for our analysis.
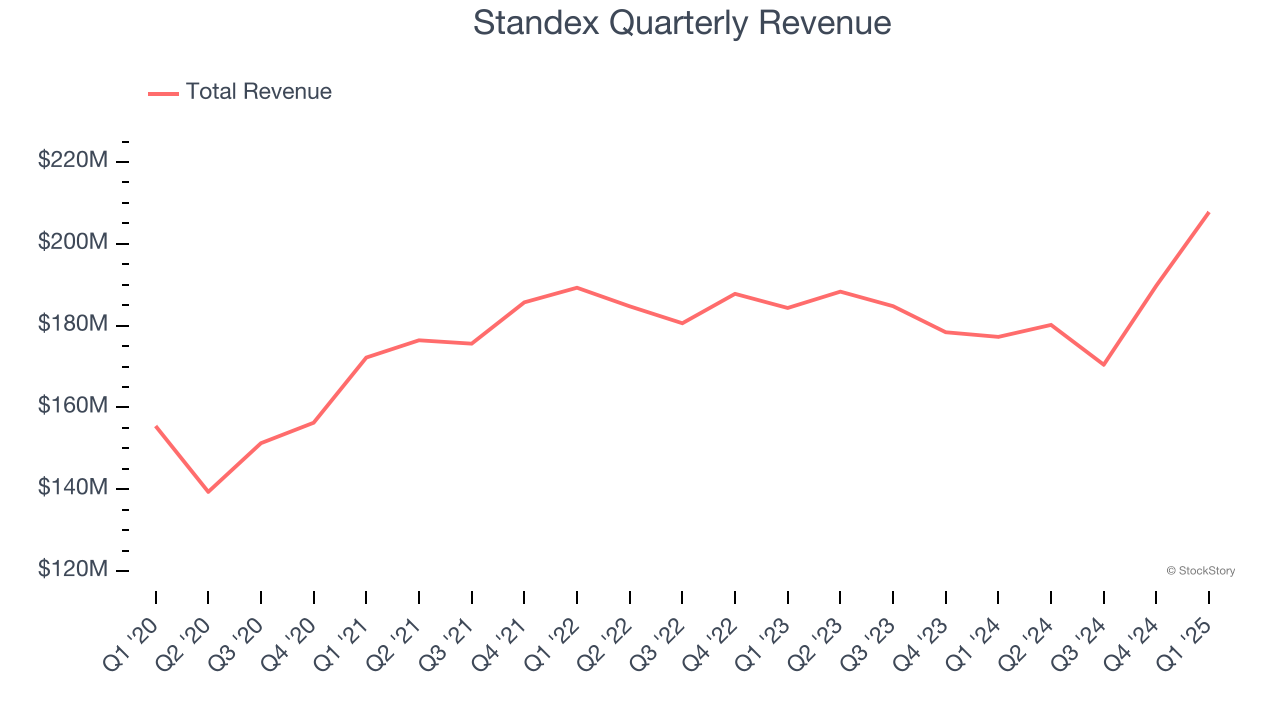
Long-term growth is the most important, but within industrials, a half-decade historical view may miss new industry trends or demand cycles. Standex’s recent performance shows its demand has slowed as its revenue was flat over the last two years. 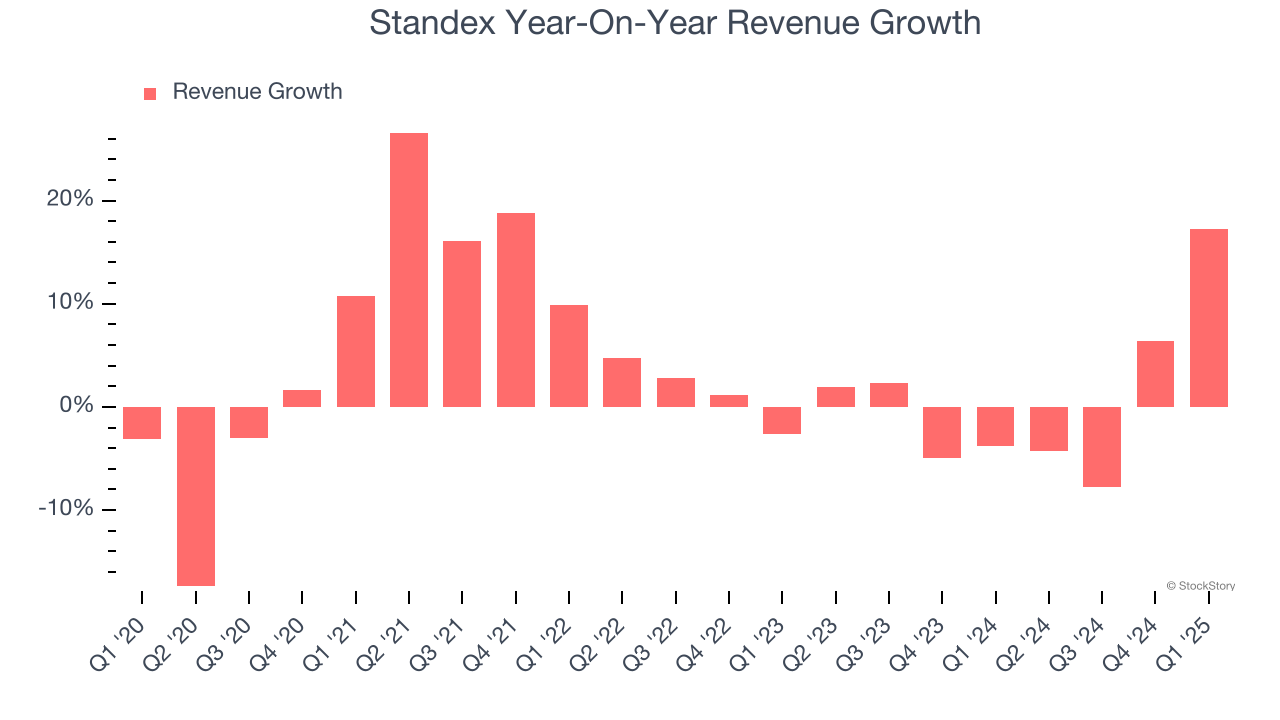
This quarter, Standex reported year-on-year revenue growth of 17.2%, and its $207.8 million of revenue exceeded Wall Street’s estimates by 1.7%.
Looking ahead, sell-side analysts expect revenue to grow 15.7% over the next 12 months, an improvement versus the last two years. This projection is eye-popping and implies its newer products and services will spur better top-line performance.
Here at StockStory, we certainly understand the potential of thematic investing. Diverse winners from Microsoft (MSFT) to Alphabet (GOOG), Coca-Cola (KO) to Monster Beverage (MNST) could all have been identified as promising growth stories with a megatrend driving the growth. So, in that spirit, we’ve identified a relatively under-the-radar profitable growth stock benefiting from the rise of AI, available to you FREE via this link.
Operating Margin
Standex has been an efficient company over the last five years. It was one of the more profitable businesses in the industrials sector, boasting an average operating margin of 13.9%. This result isn’t surprising as its high gross margin gives it a favorable starting point.
Analyzing the trend in its profitability, Standex’s operating margin rose by 3.6 percentage points over the last five years, as its sales growth gave it operating leverage.
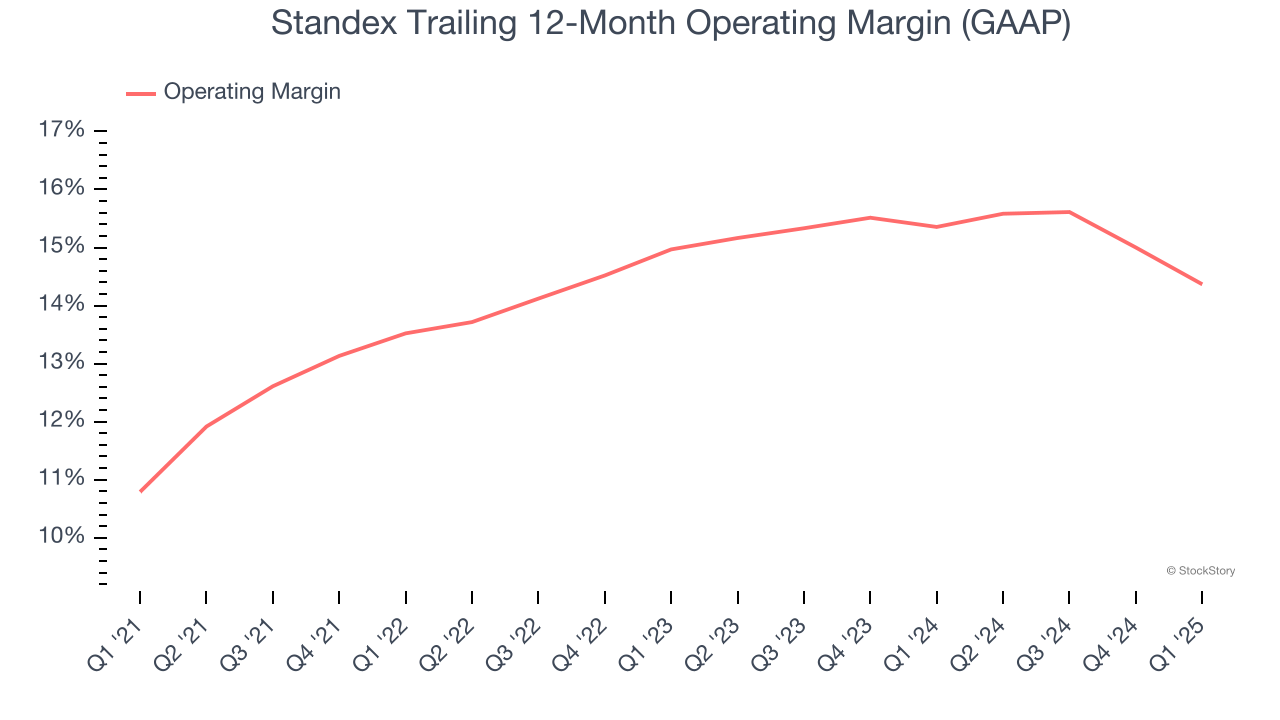
This quarter, Standex generated an operating profit margin of 12.6%, down 2.3 percentage points year on year. Conversely, its revenue and gross margin actually rose, so we can assume it was less efficient because its operating expenses like marketing, R&D, and administrative overhead grew faster than its revenue.
Earnings Per Share
We track the long-term change in earnings per share (EPS) for the same reason as long-term revenue growth. Compared to revenue, however, EPS highlights whether a company’s growth is profitable.
Standex’s EPS grew at a remarkable 12.2% compounded annual growth rate over the last five years, higher than its 3.4% annualized revenue growth. This tells us the company became more profitable on a per-share basis as it expanded.
Diving into the nuances of Standex’s earnings can give us a better understanding of its performance. As we mentioned earlier, Standex’s operating margin declined this quarter but expanded by 3.6 percentage points over the last five years. Its share count also shrank by 2.7%, and these factors together are positive signs for shareholders because improving profitability and share buybacks turbocharge EPS growth relative to revenue growth. 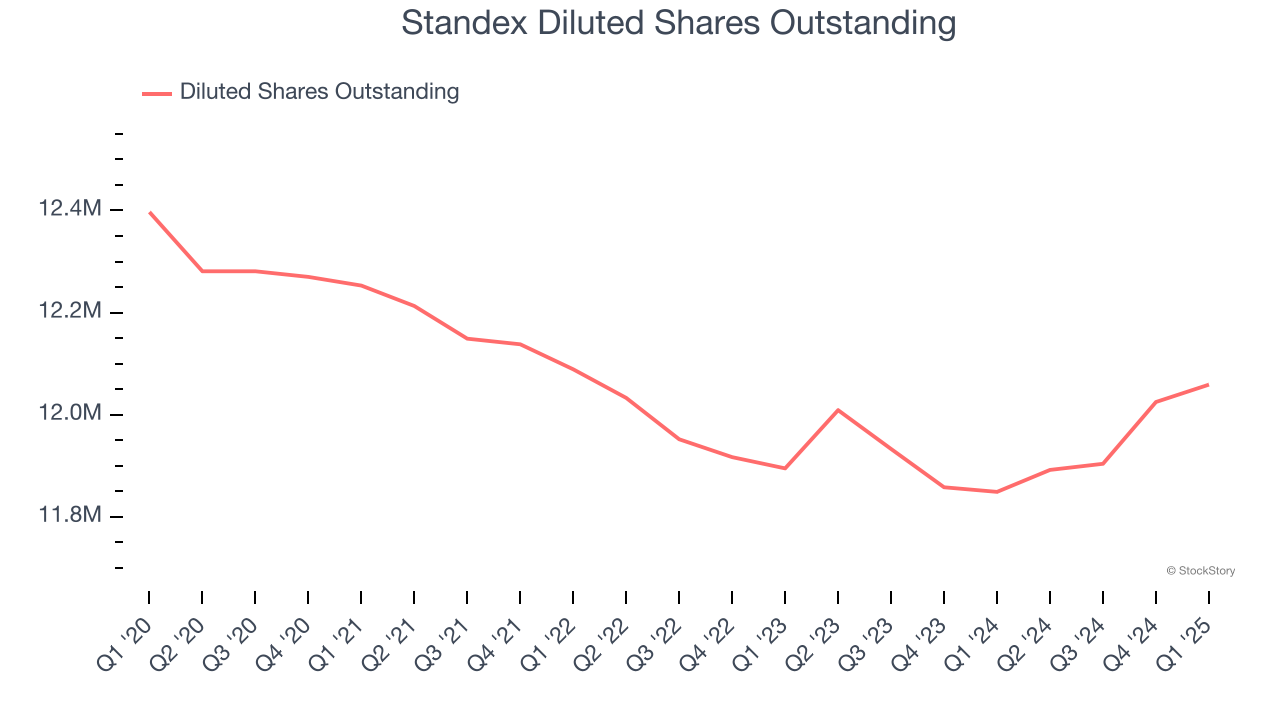
Like with revenue, we analyze EPS over a shorter period to see if we are missing a change in the business.
For Standex, its two-year annual EPS growth of 5.9% was lower than its five-year trend. We hope its growth can accelerate in the future.
In Q1, Standex reported EPS at $1.95, up from $1.75 in the same quarter last year. This print beat analysts’ estimates by 1.5%. Over the next 12 months, Wall Street expects Standex’s full-year EPS of $7.33 to grow 20.6%.
Key Takeaways from Standex’s Q1 Results
It was encouraging to see Standex beat analysts’ revenue expectations this quarter. On the other hand, its EBITDA slightly missed. Overall, this print was mixed. The stock remained flat at $144.85 immediately after reporting.
Should you buy the stock or not? If you’re making that decision, you should consider the bigger picture of valuation, business qualities, as well as the latest earnings. We cover that in our actionable full research report which you can read here, it’s free.