Medical technology company Stryker (NYSE: SYK) reported Q1 CY2025 results exceeding the market’s revenue expectations, with sales up 11.9% year on year to $5.87 billion. Its non-GAAP profit of $2.84 per share was 4% above analysts’ consensus estimates.
Is now the time to buy Stryker? Find out by accessing our full research report, it’s free.
Stryker (SYK) Q1 CY2025 Highlights:
- Revenue: $5.87 billion vs analyst estimates of $5.68 billion (11.9% year-on-year growth, 3.2% beat)
- Adjusted EPS: $2.84 vs analyst estimates of $2.73 (4% beat)
- Adjusted EPS guidance for the full year is $13.33 at the midpoint, missing analyst estimates by 1%
- Operating Margin: 14.3%, down from 18.5% in the same quarter last year
- Free Cash Flow Margin: 2.2%, up from 0.7% in the same quarter last year
- Organic Revenue rose 10.1% year on year, in line with the same quarter last year
- Market Capitalization: $142.7 billion
“Our 2024 momentum continued into the first quarter as we delivered double-digit organic sales growth and continued to expand adjusted operating margins,” said Kevin A. Lobo, Chair and CEO.
Company Overview
With over 150 million patients impacted annually through its innovative healthcare technologies, Stryker (NYSE: SYK) develops and manufactures advanced medical devices and equipment across orthopedics, surgical tools, neurotechnology, and patient care solutions.
Sales Growth
A company’s long-term performance is an indicator of its overall quality. Any business can have short-term success, but a top-tier one grows for years. Over the last five years, Stryker grew its sales at a decent 9.2% compounded annual growth rate. Its growth was slightly above the average healthcare company and shows its offerings resonate with customers.

We at StockStory place the most emphasis on long-term growth, but within healthcare, a half-decade historical view may miss recent innovations or disruptive industry trends. Stryker’s annualized revenue growth of 10.7% over the last two years is above its five-year trend, suggesting some bright spots. 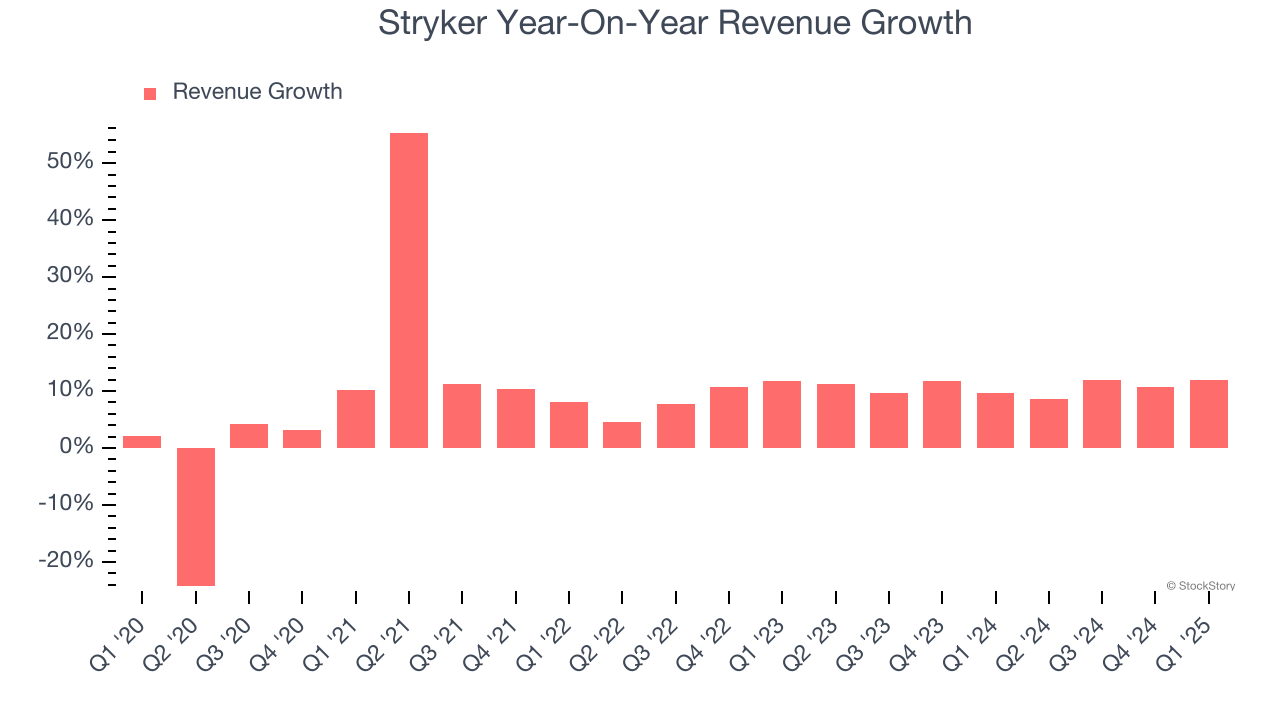
We can better understand the company’s sales dynamics by analyzing its organic revenue, which strips out one-time events like acquisitions and currency fluctuations that don’t accurately reflect its fundamentals. Over the last two years, Stryker’s organic revenue averaged 10.4% year-on-year growth. Because this number aligns with its normal revenue growth, we can see the company’s core operations (not acquisitions and divestitures) drove most of its results. 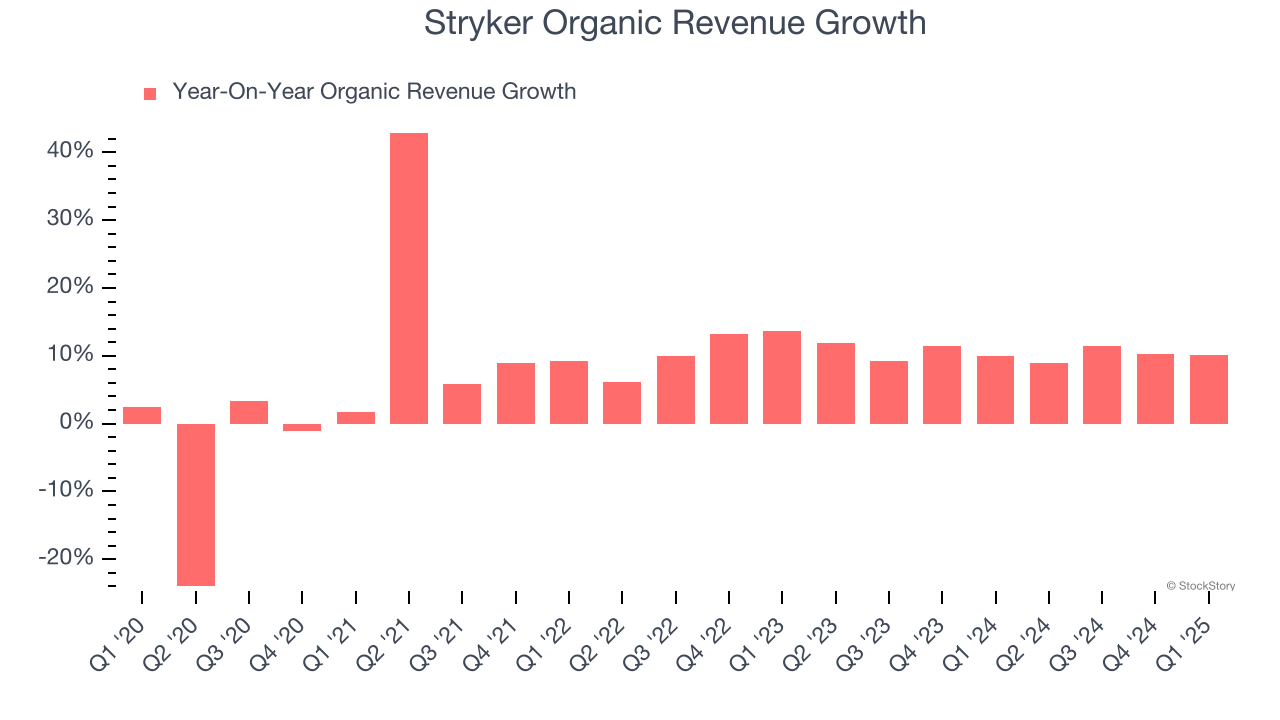
This quarter, Stryker reported year-on-year revenue growth of 11.9%, and its $5.87 billion of revenue exceeded Wall Street’s estimates by 3.2%.
Looking ahead, sell-side analysts expect revenue to grow 7.5% over the next 12 months, a deceleration versus the last two years. We still think its growth trajectory is satisfactory given its scale and implies the market sees success for its products and services.
Here at StockStory, we certainly understand the potential of thematic investing. Diverse winners from Microsoft (MSFT) to Alphabet (GOOG), Coca-Cola (KO) to Monster Beverage (MNST) could all have been identified as promising growth stories with a megatrend driving the growth. So, in that spirit, we’ve identified a relatively under-the-radar profitable growth stock benefiting from the rise of AI, available to you FREE via this link.
Operating Margin
Stryker has managed its cost base well over the last five years. It demonstrated solid profitability for a healthcare business, producing an average operating margin of 16.2%.
Analyzing the trend in its profitability, Stryker’s operating margin rose by 1.4 percentage points over the last five years, as its sales growth gave it operating leverage. Zooming into its more recent performance, however, we can see the company’s margin has decreased by 1.2 percentage points on a two-year basis. If Stryker wants to pass our bar, it must prove it can expand its profitability consistently.
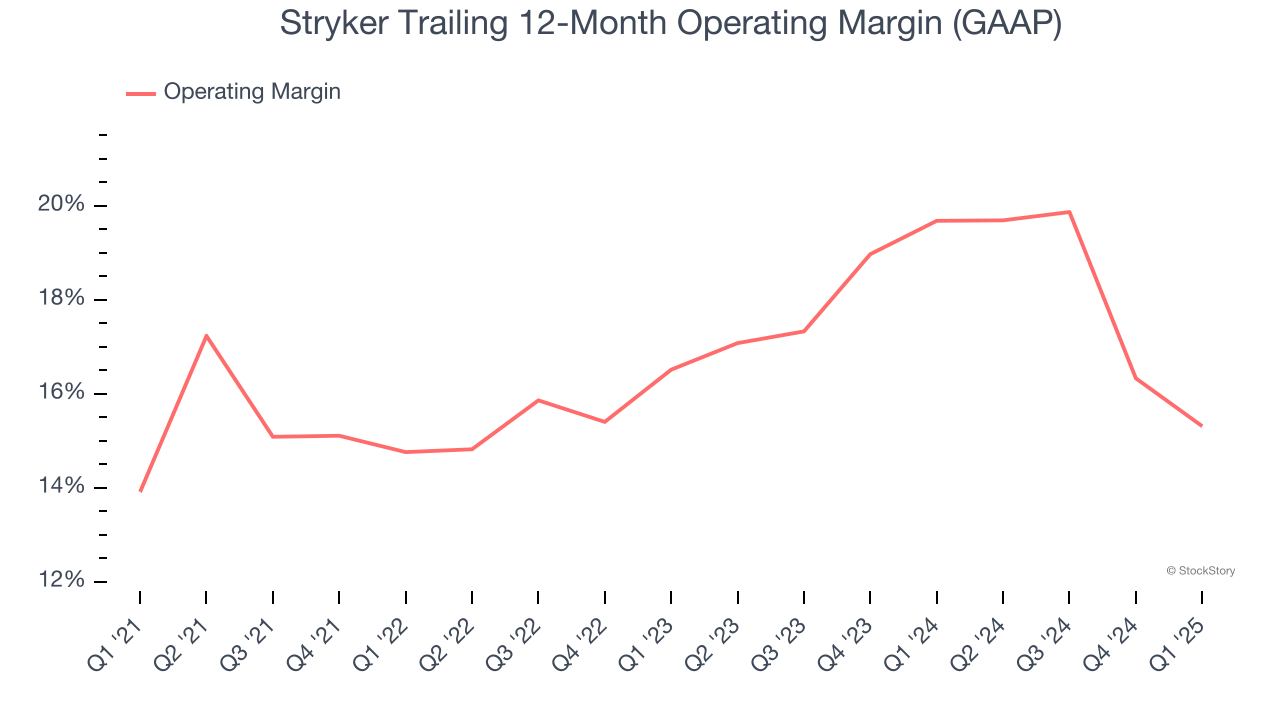
This quarter, Stryker generated an operating profit margin of 14.3%, down 4.3 percentage points year on year. This contraction shows it was less efficient because its expenses grew faster than its revenue.
Earnings Per Share
We track the long-term change in earnings per share (EPS) for the same reason as long-term revenue growth. Compared to revenue, however, EPS highlights whether a company’s growth is profitable.
Stryker’s solid 8.8% annual EPS growth over the last five years aligns with its revenue performance. This tells us its incremental sales were profitable.
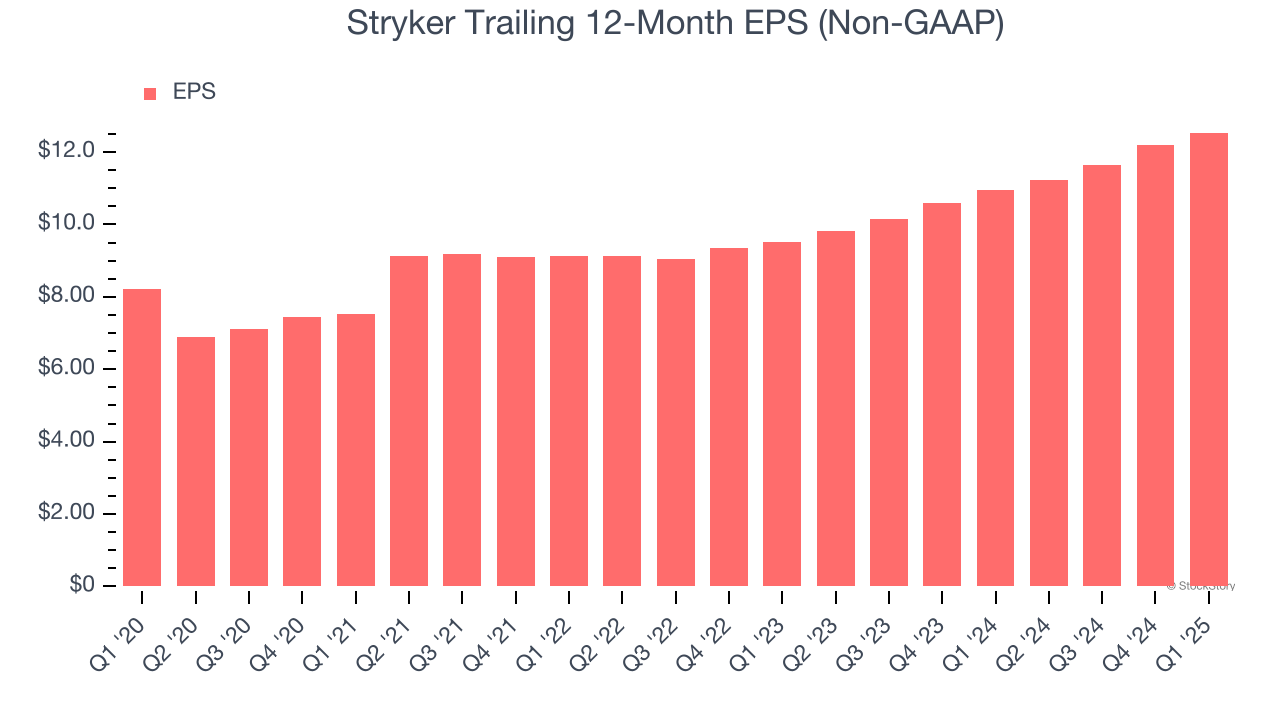
In Q1, Stryker reported EPS at $2.84, up from $2.50 in the same quarter last year. This print beat analysts’ estimates by 4%. Over the next 12 months, Wall Street expects Stryker’s full-year EPS of $12.54 to grow 10.2%.
Key Takeaways from Stryker’s Q1 Results
We enjoyed seeing Stryker beat analysts’ revenue expectations this quarter. We were also glad its organic revenue outperformed Wall Street’s estimates. On the other hand, its full-year EPS guidance slightly missed. Overall, this print was mixed. The stock remained flat at $372 immediately after reporting.
Big picture, is Stryker a buy here and now? The latest quarter does matter, but not nearly as much as longer-term fundamentals and valuation, when deciding if the stock is a buy. We cover that in our actionable full research report which you can read here, it’s free.