OLED provider Universal Display (NASDAQ: OLED) announced better-than-expected revenue in Q1 CY2025, but sales were flat year on year at $166.3 million. The company expects the full year’s revenue to be around $670 million, close to analysts’ estimates. Its GAAP profit of $1.35 per share was 25.4% above analysts’ consensus estimates.
Is now the time to buy Universal Display? Find out by accessing our full research report, it’s free.
Universal Display (OLED) Q1 CY2025 Highlights:
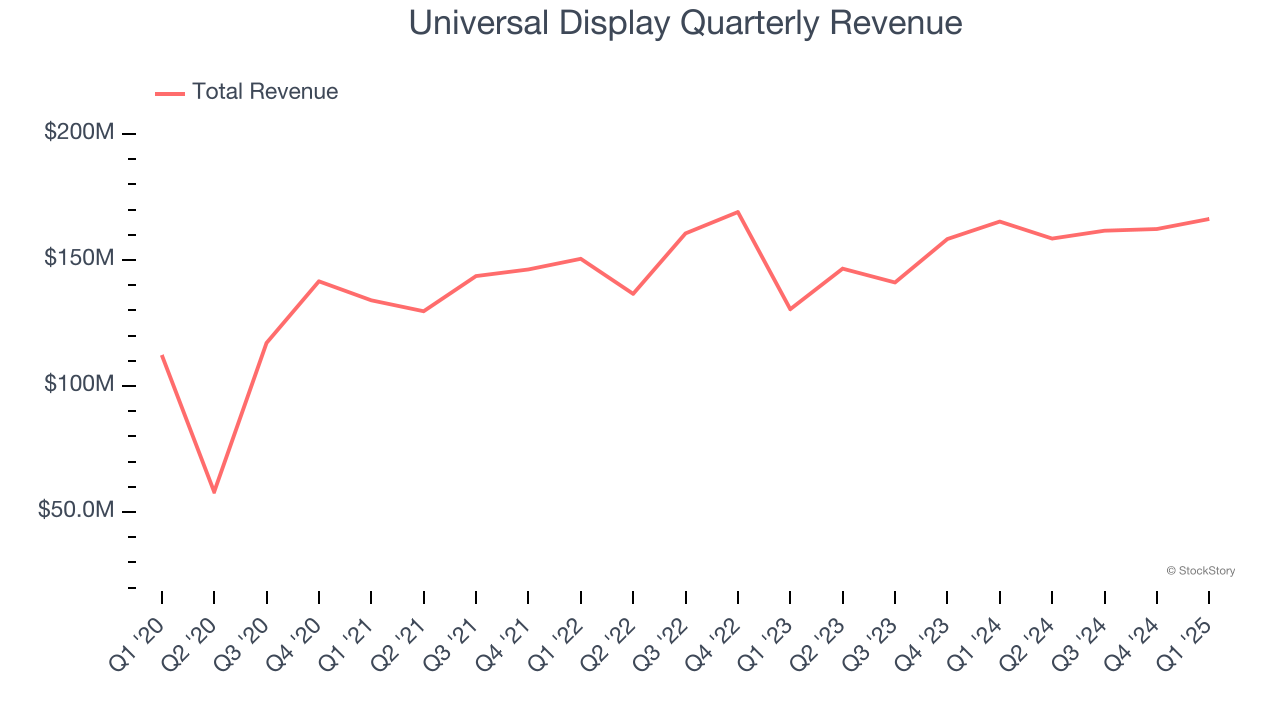
- Revenue: $166.3 million vs analyst estimates of $155.6 million (flat year on year, 6.8% beat)
- EPS (GAAP): $1.35 vs analyst estimates of $1.08 (25.4% beat)
- The company reconfirmed its revenue guidance for the full year of $670 million at the midpoint
- Operating Margin: 41.9%, up from 38% in the same quarter last year
- Free Cash Flow Margin: 10.5%, down from 39.3% in the same quarter last year
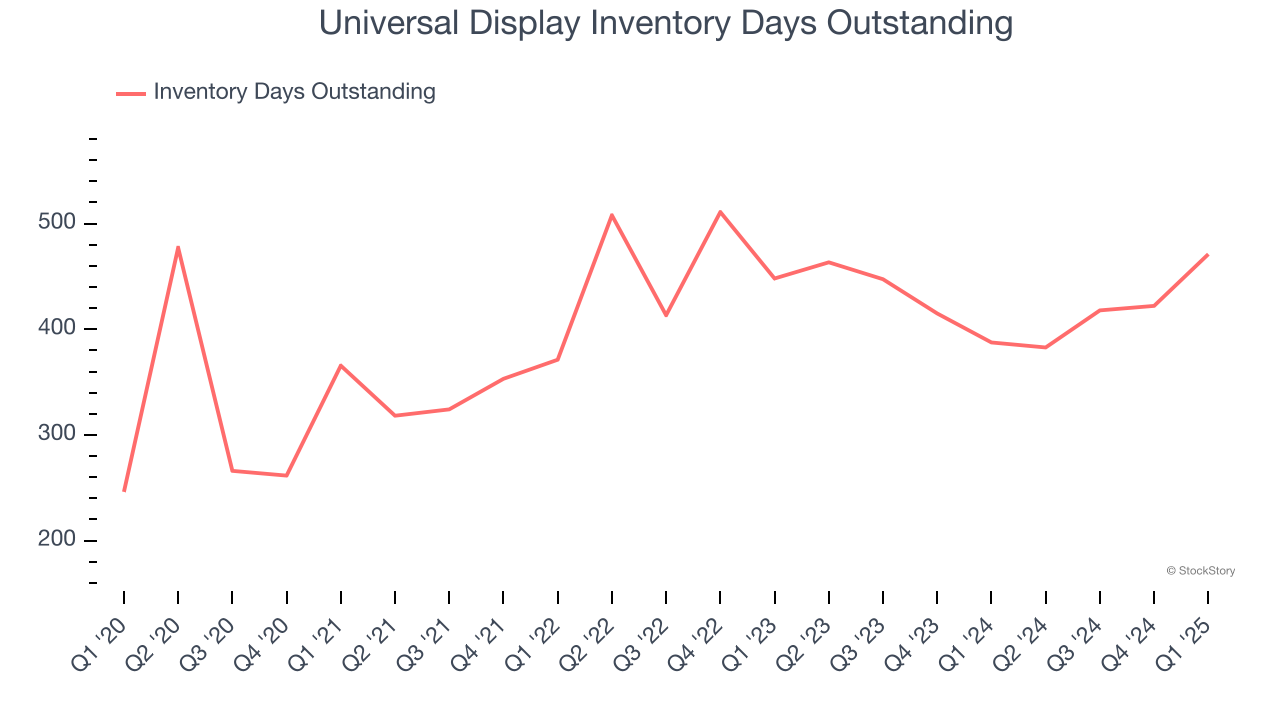
- Inventory Days Outstanding: 471, up from 422 in the previous quarter
- Market Capitalization: $5.98 billion
“We began 2025 on a solid financial note and continue to remain confident in the long-term growth trajectory of the OLED market. At the same time, we recognize the increasing complexity and uncertainty of the global landscape. In this environment, we are committed to our long-term strategy of advancing our leadership through the continuous invention, development and delivery of state-of-the-art OLED technologies and materials. With a powerful innovation engine, strong balance sheet, resilient supply chain, and operational agility, we are well-positioned to adapt to change, respond swiftly and continue supporting our customers and partners,” said Brian Millard, Vice President and Chief Financial Officer of Universal Display Corporation.
Company Overview
Serving major consumer electronics manufacturers, Universal Display (NASDAQ: OLED) is a provider of organic light emitting diode (OLED) technologies used in display and lighting applications.
Sales Growth
A company’s long-term sales performance can indicate its overall quality. Any business can put up a good quarter or two, but the best consistently grow over the long haul. Luckily, Universal Display’s sales grew at a decent 8.6% compounded annual growth rate over the last five years. Its growth was slightly above the average semiconductor company and shows its offerings resonate with customers. Semiconductors are a cyclical industry, and long-term investors should be prepared for periods of high growth followed by periods of revenue contractions.
Long-term growth is the most important, but short-term results matter for semiconductors because the rapid pace of technological innovation (Moore's Law) could make yesterday's hit product obsolete today. Universal Display’s recent performance shows its demand has slowed as its annualized revenue growth of 4.3% over the last two years was below its five-year trend. 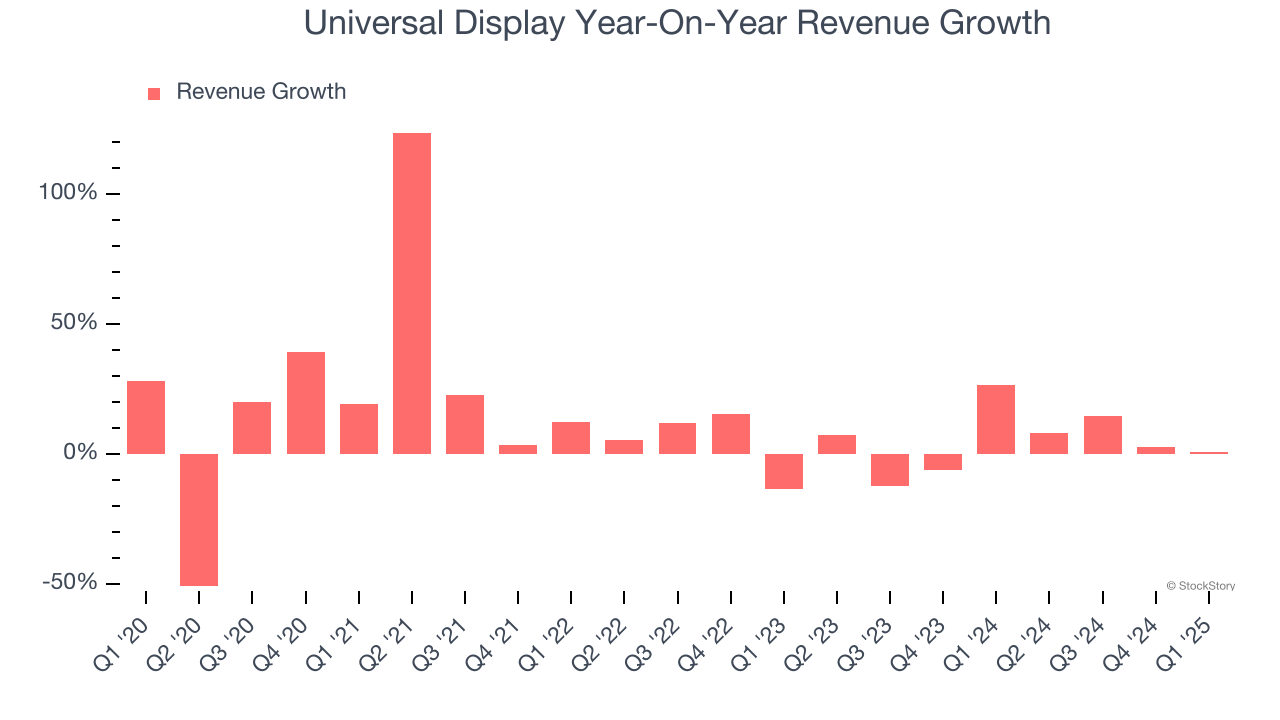
This quarter, Universal Display’s $166.3 million of revenue was flat year on year but beat Wall Street’s estimates by 6.8%.
Looking ahead, sell-side analysts expect revenue to grow 5.2% over the next 12 months, similar to its two-year rate. This projection doesn't excite us and implies its newer products and services will not accelerate its top-line performance yet. At least the company is tracking well in other measures of financial health.
Unless you’ve been living under a rock, it should be obvious by now that generative AI is going to have a huge impact on how large corporations do business. While Nvidia and AMD are trading close to all-time highs, we prefer a lesser-known (but still profitable) stock benefiting from the rise of AI. Click here to access our free report one of our favorites growth stories.
Product Demand & Outstanding Inventory
Days Inventory Outstanding (DIO) is an important metric for chipmakers, as it reflects a business’ capital intensity and the cyclical nature of semiconductor supply and demand. In a tight supply environment, inventories tend to be stable, allowing chipmakers to exert pricing power. Steadily increasing DIO can be a warning sign that demand is weak, and if inventories continue to rise, the company may have to downsize production.
This quarter, Universal Display’s DIO came in at 471, which is 70 days above its five-year average, suggesting that the company’s inventory has grown to higher levels than we’ve seen in the past.
Key Takeaways from Universal Display’s Q1 Results
We were impressed by how significantly Universal Display blew past analysts’ EPS expectations this quarter. We were also glad its revenue outperformed Wall Street’s estimates. On the other hand, its inventory levels materially increased. Overall, we think this was still a solid quarter with some key areas of upside. The stock traded up 2.9% to $145 immediately following the results.
Sure, Universal Display had a solid quarter, but if we look at the bigger picture, is this stock a buy? What happened in the latest quarter matters, but not as much as longer-term business quality and valuation, when deciding whether to invest in this stock. We cover that in our actionable full research report which you can read here, it’s free.