
Behavioral health company Acadia Healthcare (NASDAQ: ACHC) met Wall Street’s revenue expectations in Q1 CY2025, but sales were flat year on year at $770.5 million. The company’s outlook for the full year was close to analysts’ estimates with revenue guided to $3.35 billion at the midpoint. Its non-GAAP profit of $0.40 per share was 12% above analysts’ consensus estimates.
Is now the time to buy Acadia Healthcare? Find out by accessing our full research report, it’s free.
Acadia Healthcare (ACHC) Q1 CY2025 Highlights:
- Revenue: $770.5 million vs analyst estimates of $769.7 million (flat year on year, in line)
- Adjusted EPS: $0.40 vs analyst estimates of $0.36 (12% beat)
- Adjusted EBITDA: $134.2 million vs analyst estimates of $132.1 million (17.4% margin, 1.6% beat)
- The company reconfirmed its revenue guidance for the full year of $3.35 billion at the midpoint
- Adjusted EPS guidance for the full year is $2.65 at the midpoint, roughly in line with what analysts were expecting
- EBITDA guidance for the full year is $700 million at the midpoint, in line with analyst expectations
- Free Cash Flow was -$163.2 million compared to -$463.7 million in the same quarter last year
- Sales Volumes fell 1.1% year on year, in line with the same quarter last year
- Market Capitalization: $2.20 billion
Company Overview
With a network of over 250 facilities serving patients in 38 states and Puerto Rico, Acadia Healthcare (NASDAQ: ACHC) operates facilities providing mental health and substance use disorder treatment services across the United States.
Sales Growth
A company’s long-term sales performance can indicate its overall quality. Any business can experience short-term success, but top-performing ones enjoy sustained growth for years. Regrettably, Acadia Healthcare’s sales grew at a tepid 2% compounded annual growth rate over the last five years. This fell short of our benchmarks and is a rough starting point for our analysis.
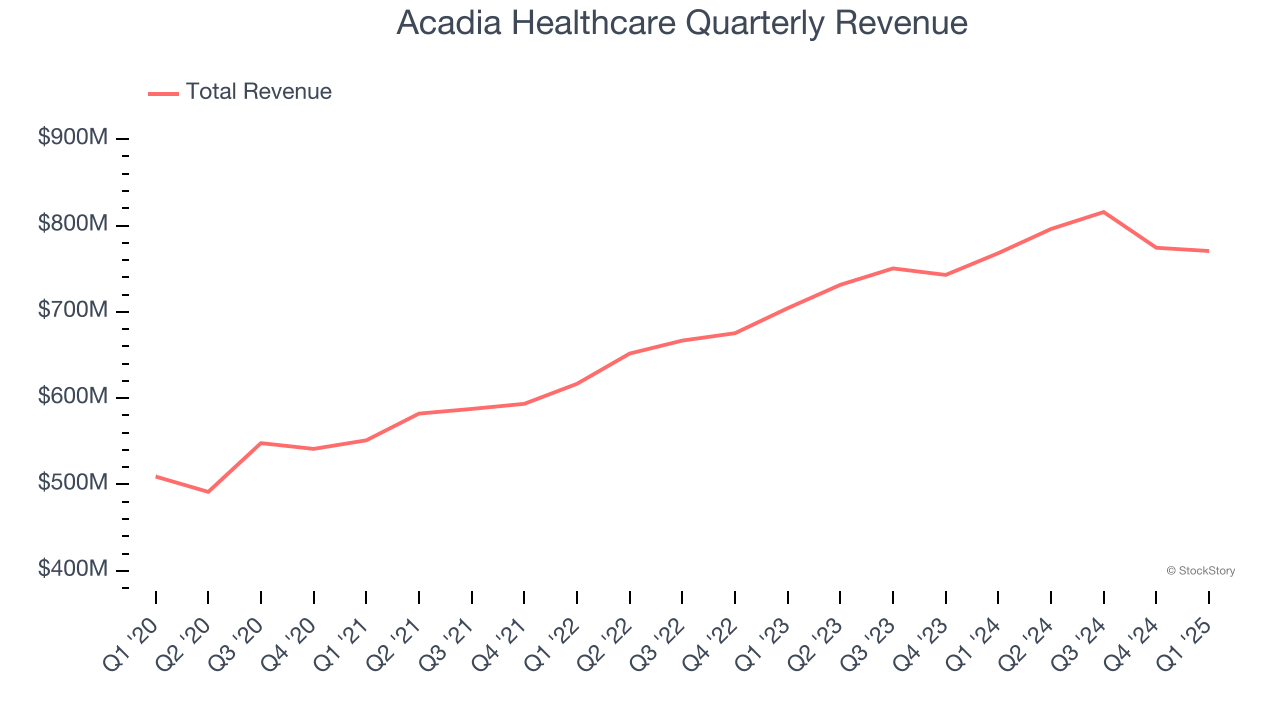
Long-term growth is the most important, but within healthcare, a half-decade historical view may miss new innovations or demand cycles. Acadia Healthcare’s annualized revenue growth of 8.2% over the last two years is above its five-year trend, suggesting some bright spots. 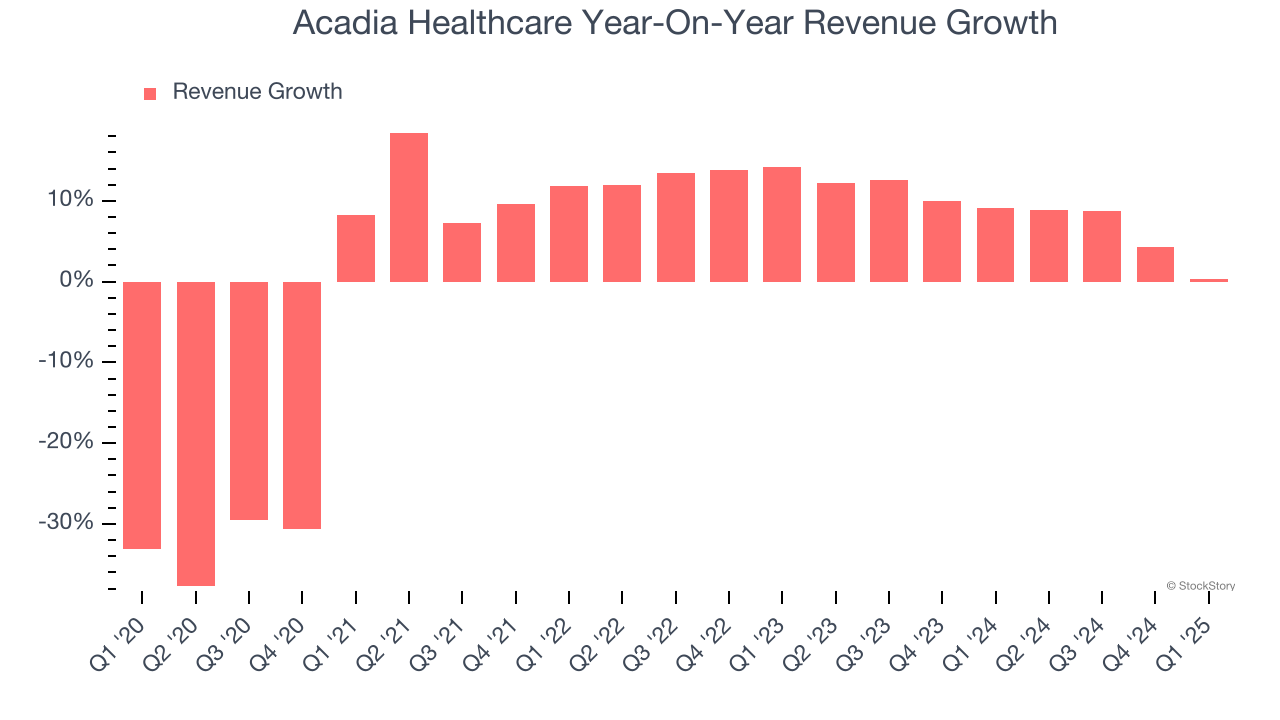
We can better understand the company’s revenue dynamics by analyzing its number of admissions, which reached 48,507 in the latest quarter. Over the last two years, Acadia Healthcare’s admissions averaged 2.2% year-on-year growth. Because this number is lower than its revenue growth, we can see the company benefited from price increases. 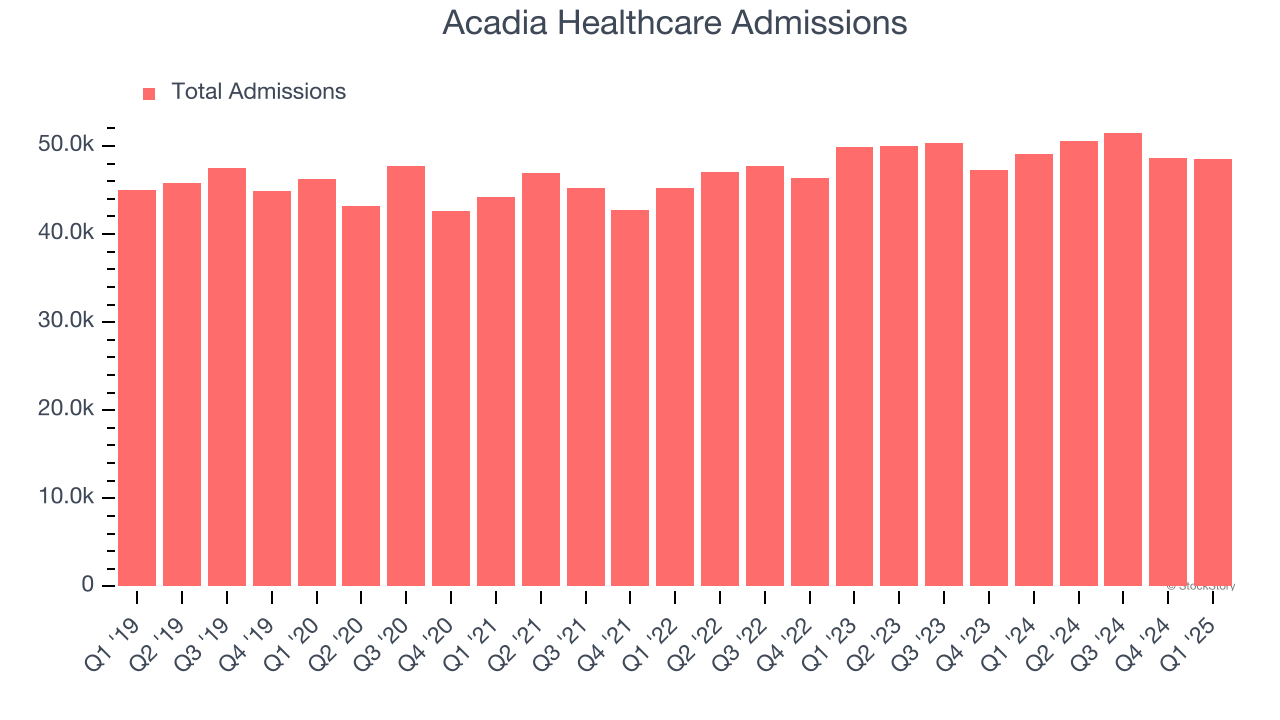
This quarter, Acadia Healthcare’s $770.5 million of revenue was flat year on year and in line with Wall Street’s estimates.
Looking ahead, sell-side analysts expect revenue to grow 8.2% over the next 12 months, similar to its two-year rate. This projection is admirable and implies the market sees success for its products and services.
Unless you’ve been living under a rock, it should be obvious by now that generative AI is going to have a huge impact on how large corporations do business. While Nvidia and AMD are trading close to all-time highs, we prefer a lesser-known (but still profitable) stock benefiting from the rise of AI. Click here to access our free report one of our favorites growth stories.
Operating Margin
Acadia Healthcare has done a decent job managing its cost base over the last five years. The company has produced an average operating margin of 13%, higher than the broader healthcare sector.
Analyzing the trend in its profitability, Acadia Healthcare’s operating margin decreased by 5.7 percentage points over the last five years. The company’s two-year trajectory also shows it failed to get its profitability back to the peak as its margin fell by 3.6 percentage points. This performance was poor no matter how you look at it - it shows its expenses were rising and it couldn’t pass those costs onto its customers.
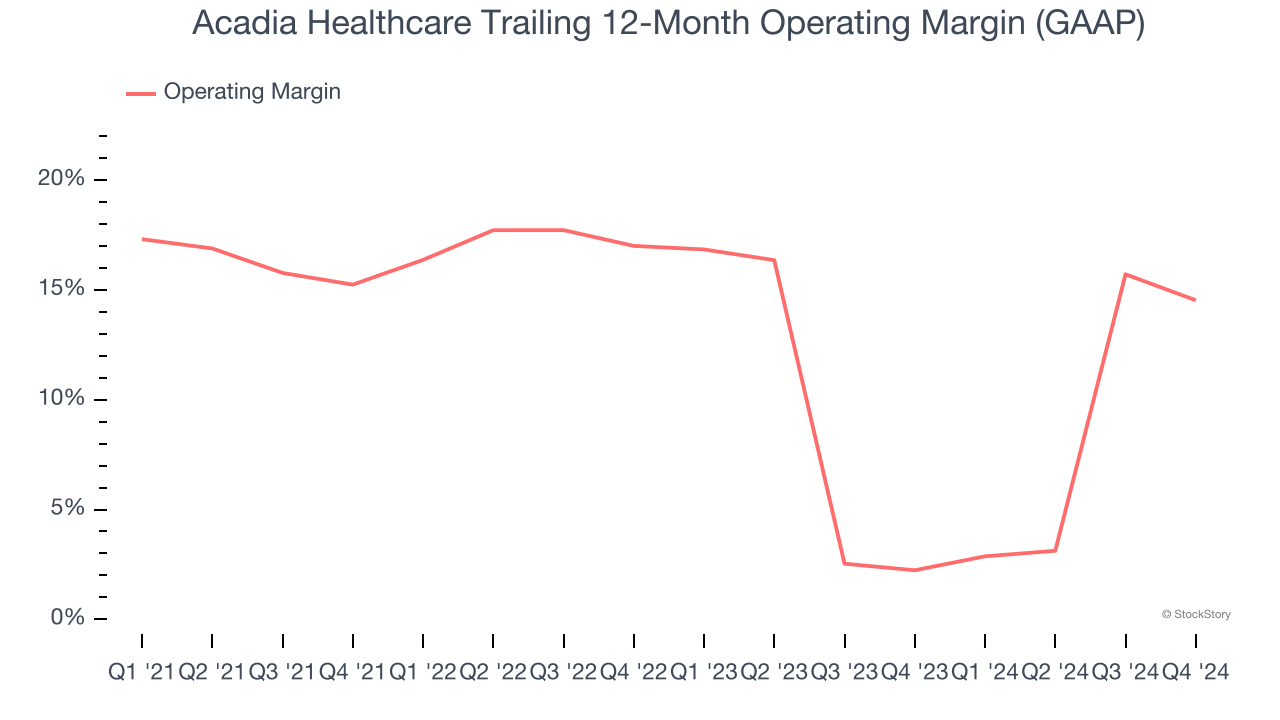
in line with the same quarter last year. This indicates the company’s overall cost structure has been relatively stable.
Earnings Per Share
Revenue trends explain a company’s historical growth, but the long-term change in earnings per share (EPS) points to the profitability of that growth – for example, a company could inflate its sales through excessive spending on advertising and promotions.
Acadia Healthcare’s EPS grew at a decent 6.8% compounded annual growth rate over the last five years, higher than its 2% annualized revenue growth. However, we take this with a grain of salt because its operating margin didn’t expand and it didn’t repurchase its shares, meaning the delta came from reduced interest expenses or taxes.
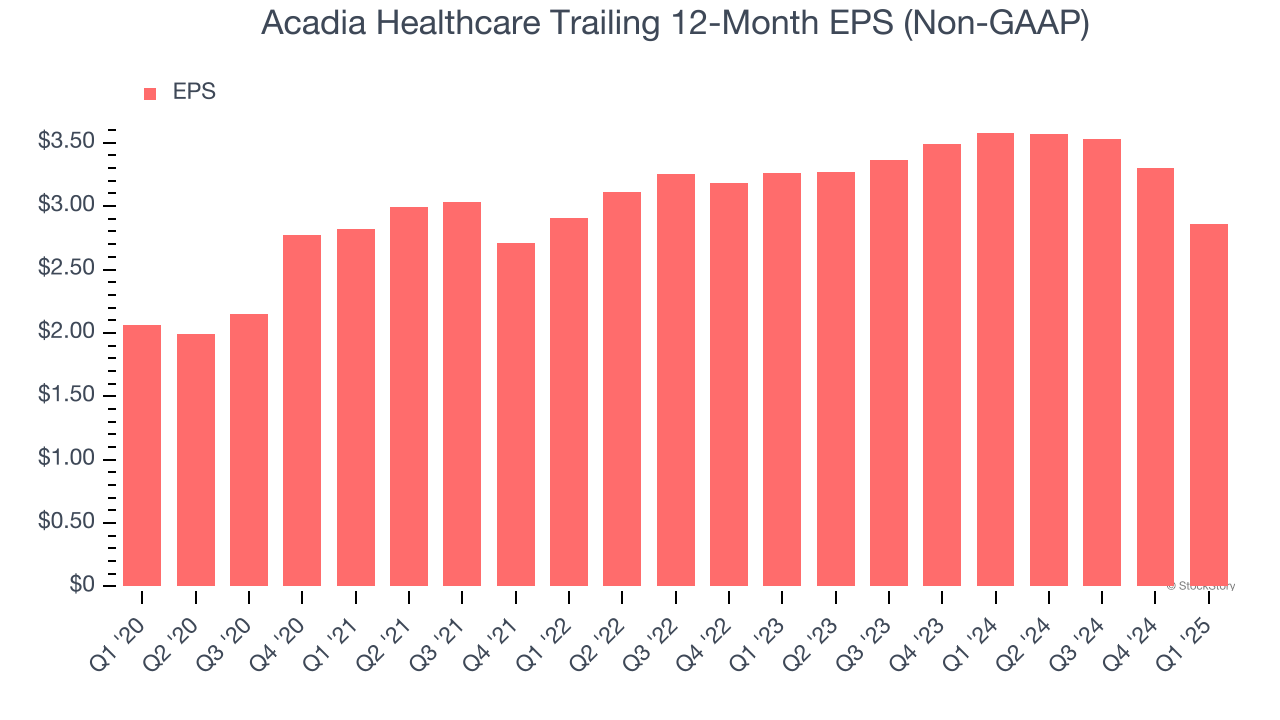
In Q1, Acadia Healthcare reported EPS at $0.40, down from $0.84 in the same quarter last year. Despite falling year on year, this print easily cleared analysts’ estimates. Over the next 12 months, Wall Street expects Acadia Healthcare’s full-year EPS of $2.86 to shrink by 4.7%.
Key Takeaways from Acadia Healthcare’s Q1 Results
It was encouraging to see Acadia Healthcare beat analysts’ EPS and EBITDA expectations this quarter. Zooming out, we think this was a decent quarter. The stock traded up 4.8% to $27.11 immediately after reporting.
Is Acadia Healthcare an attractive investment opportunity at the current price? We think that the latest quarter is only one piece of the longer-term business quality puzzle. Quality, when combined with valuation, can help determine if the stock is a buy. We cover that in our actionable full research report which you can read here, it’s free.