
Dialysis provider DaVita Inc. (NYSE: DVA) announced better-than-expected revenue in Q1 CY2025, with sales up 5% year on year to $3.22 billion. Its non-GAAP profit of $2 per share was 1% below analysts’ consensus estimates.
Is now the time to buy DaVita? Find out by accessing our full research report, it’s free.
DaVita (DVA) Q1 CY2025 Highlights:
- Revenue: $3.22 billion vs analyst estimates of $3.21 billion (5% year-on-year growth, 0.5% beat)
- Adjusted EPS: $2 vs analyst expectations of $2.02 (1% miss)
- Adjusted EBITDA: $645.1 million vs analyst estimates of $609.3 million (20% margin, 5.9% beat)
- Management reiterated its full-year Adjusted EPS guidance of $10.75 at the midpoint
- Operating Margin: 13.6%, down from 15.8% in the same quarter last year
- Free Cash Flow was $36.75 million, up from -$255.9 million in the same quarter last year
- Sales Volumes fell 1.6% year on year (0.5% in the same quarter last year)
- Market Capitalization: $11.05 billion
"Our strong first quarter performance demonstrates the stability and consistency of our operating model" said Javier Rodriguez, CEO of DaVita Inc.
Company Overview
With over 2,600 dialysis centers across the United States and a presence in 13 countries, DaVita (NYSE: DVA) operates a network of dialysis centers providing treatment and care for patients with chronic kidney disease and end-stage kidney disease.
Sales Growth
Examining a company’s long-term performance can provide clues about its quality. Any business can put up a good quarter or two, but many enduring ones grow for years. Unfortunately, DaVita’s 2.5% annualized revenue growth over the last five years was tepid. This fell short of our benchmarks and is a poor baseline for our analysis.

We at StockStory place the most emphasis on long-term growth, but within healthcare, a half-decade historical view may miss recent innovations or disruptive industry trends. DaVita’s annualized revenue growth of 5.4% over the last two years is above its five-year trend, but we were still disappointed by the results. 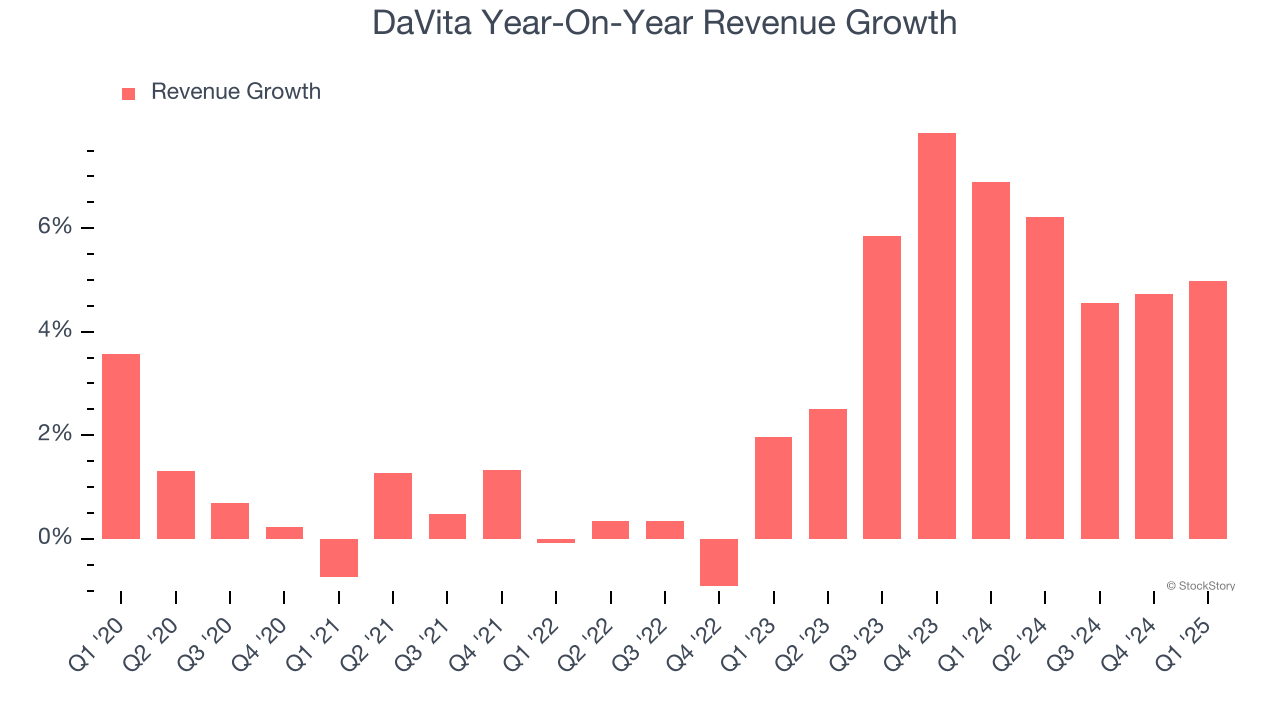
We can better understand the company’s revenue dynamics by analyzing its number of treatments, which reached 7.04 million in the latest quarter. Over the last two years, DaVita’s treatments were flat. Because this number is lower than its revenue growth, we can see the company benefited from price increases. 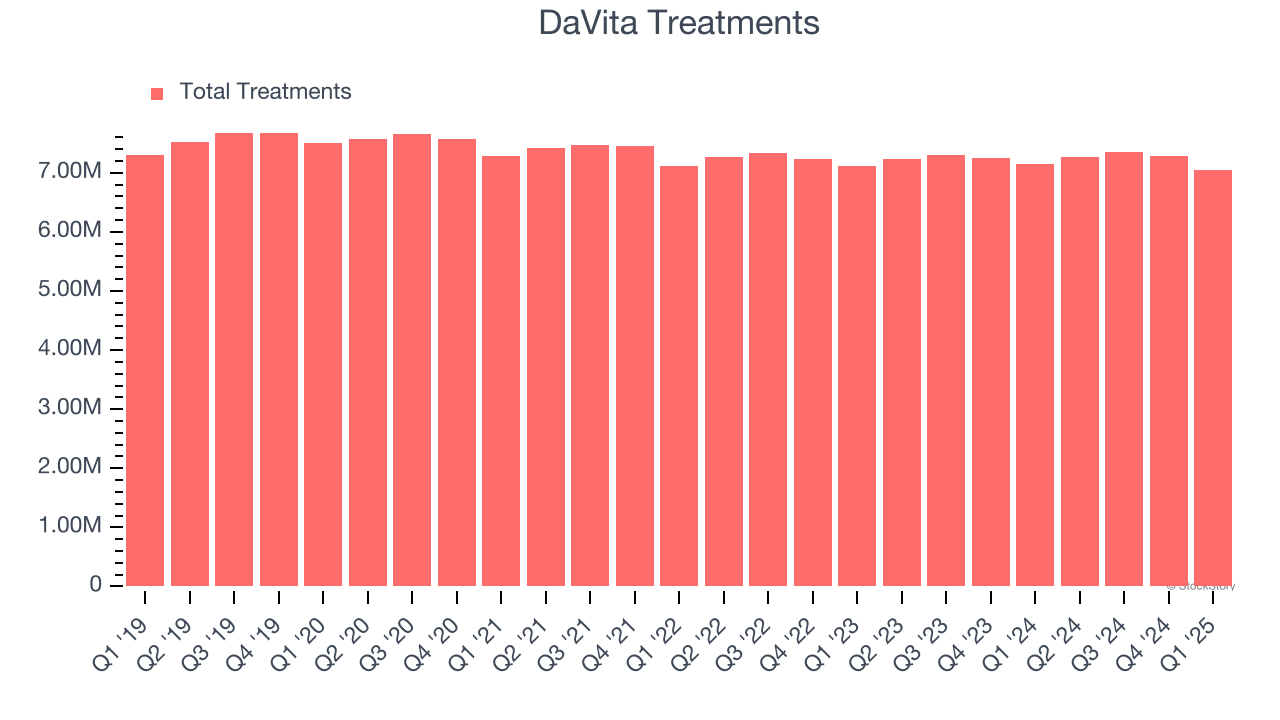
This quarter, DaVita reported modest year-on-year revenue growth of 5% but beat Wall Street’s estimates by 0.5%.
Looking ahead, sell-side analysts expect revenue to grow 4.5% over the next 12 months, similar to its two-year rate. This projection is underwhelming and suggests its newer products and services will not lead to better top-line performance yet.
Today’s young investors won’t have read the timeless lessons in Gorilla Game: Picking Winners In High Technology because it was written more than 20 years ago when Microsoft and Apple were first establishing their supremacy. But if we apply the same principles, then enterprise software stocks leveraging their own generative AI capabilities may well be the Gorillas of the future. So, in that spirit, we are excited to present our Special Free Report on a profitable, fast-growing enterprise software stock that is already riding the automation wave and looking to catch the generative AI next.
Operating Margin
DaVita has done a decent job managing its cost base over the last five years. The company has produced an average operating margin of 14.1%, higher than the broader healthcare sector.
Looking at the trend in its profitability, DaVita’s operating margin rose by 1.3 percentage points over the last five years, as its sales growth gave it operating leverage. This performance was mostly driven by its recent improvements as the company’s margin has increased by 4.5 percentage points on a two-year basis.
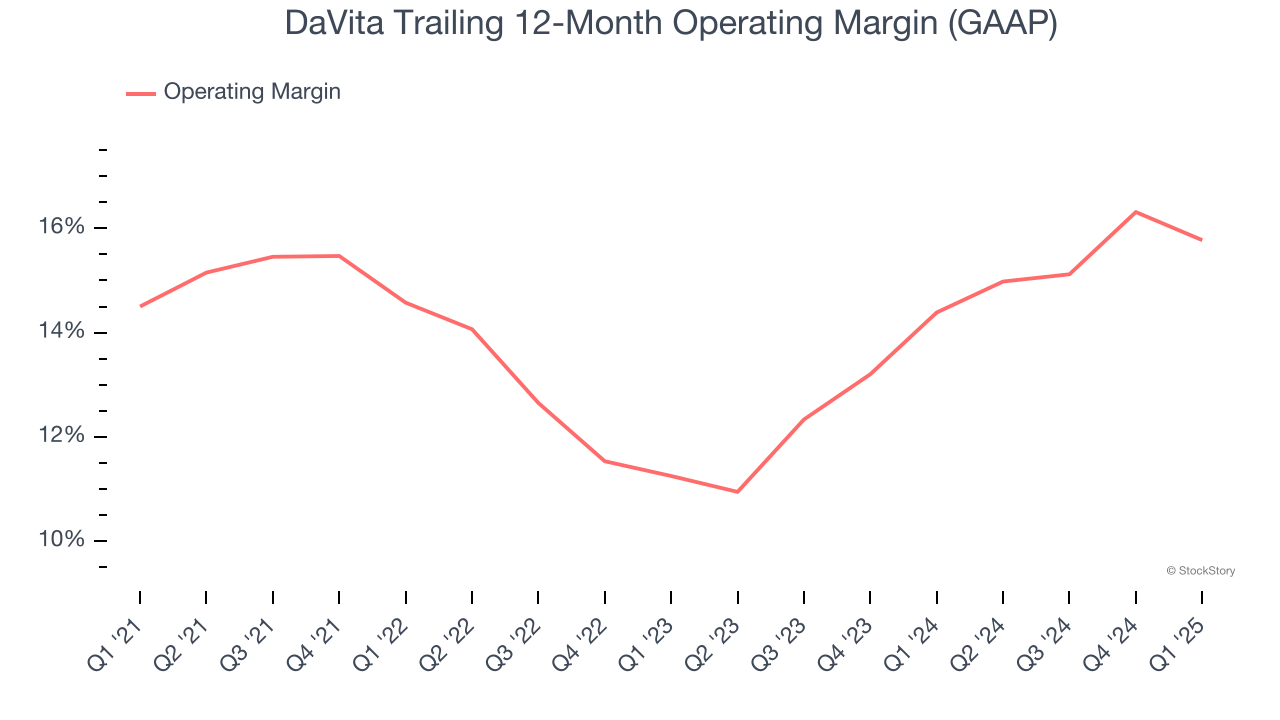
In Q1, DaVita generated an operating profit margin of 13.6%, down 2.1 percentage points year on year. This contraction shows it was less efficient because its expenses grew faster than its revenue.
Earnings Per Share
We track the long-term change in earnings per share (EPS) for the same reason as long-term revenue growth. Compared to revenue, however, EPS highlights whether a company’s growth is profitable.
DaVita’s EPS grew at a solid 7.9% compounded annual growth rate over the last five years, higher than its 2.5% annualized revenue growth. This tells us the company became more profitable on a per-share basis as it expanded.

Diving into the nuances of DaVita’s earnings can give us a better understanding of its performance. As we mentioned earlier, DaVita’s operating margin declined this quarter but expanded by 1.3 percentage points over the last five years. Its share count also shrank by 36%, and these factors together are positive signs for shareholders because improving profitability and share buybacks turbocharge EPS growth relative to revenue growth. 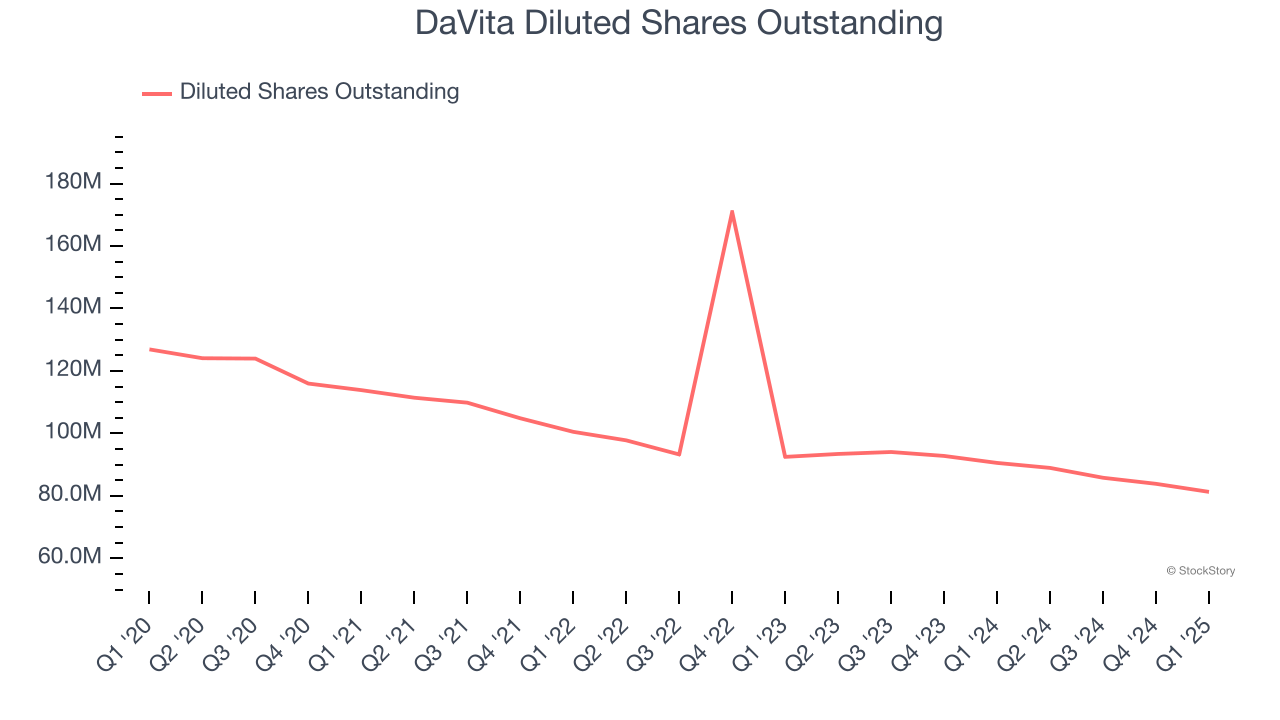
In Q1, DaVita reported EPS at $2, down from $2.26 in the same quarter last year. This print was close to analysts’ estimates. Over the next 12 months, Wall Street expects DaVita’s full-year EPS of $9.42 to grow 22.8%.
Key Takeaways from DaVita’s Q1 Results
It was good to see DaVita narrowly top analysts’ revenue and EBITDA expectations this quarter. On the other hand, its full-year EPS guidance missed significantly and its sales volume fell slightly short of Wall Street’s estimates. Overall, this quarter could have been better. The stock remained flat at $143.65 immediately following the results.
DaVita underperformed this quarter, but does that create an opportunity to invest right now? We think that the latest quarter is only one piece of the longer-term business quality puzzle. Quality, when combined with valuation, can help determine if the stock is a buy. We cover that in our actionable full research report which you can read here, it’s free.