Global media and entertainment company iHeartMedia (NASDAQ: IHRT) reported Q1 CY2025 results exceeding the market’s revenue expectations, with sales up 1% year on year to $807.1 million. On the other hand, next quarter’s revenue guidance of $905.9 million was less impressive, coming in 2.2% below analysts’ estimates. Its GAAP profit of $1.84 per share was significantly above analysts’ consensus estimates.
Is now the time to buy iHeartMedia? Find out by accessing our full research report, it’s free.
iHeartMedia (IHRT) Q1 CY2025 Highlights:
- Revenue: $807.1 million vs analyst estimates of $786.4 million (1% year-on-year growth, 2.6% beat)
- EPS (GAAP): $1.84 vs analyst estimates of -$0.52 (significant beat)
- Adjusted EBITDA: $104.6 million vs analyst estimates of $105.8 million (13% margin, 1.1% miss)
- Revenue Guidance for Q2 CY2025 is $905.9 million at the midpoint, below analyst estimates of $926.1 million
- EBITDA guidance for Q2 CY2025 is $150 million at the midpoint, below analyst estimates of $171.8 million
- Operating Margin: -3.2%, up from -4.3% in the same quarter last year
- Free Cash Flow was -$80.67 million compared to -$80.86 million in the same quarter last year
- Market Capitalization: $180.6 million
“We are pleased with our Q1 results given the uncertain environment in which we are operating now, and we think these results demonstrate the resilience and relevance of our products and the tremendous growth opportunity we have with our podcast business in particular.” said Bob Pittman, Chairman and CEO of iHeartMedia, Inc.
Company Overview
Occasionally featuring celebrity hosts like Ryan Seacrest on its shows, iHeartMedia (NASDAQ: IHRT) is a leading multimedia company renowned for its extensive network of radio stations, digital platforms, and live events across the globe.
Sales Growth
A company’s long-term sales performance can indicate its overall quality. Any business can put up a good quarter or two, but the best consistently grow over the long haul. Regrettably, iHeartMedia’s sales grew at a weak 1% compounded annual growth rate over the last five years. This was below our standards and is a tough starting point for our analysis.

Long-term growth is the most important, but within consumer discretionary, product cycles are short and revenue can be hit-driven due to rapidly changing trends and consumer preferences. iHeartMedia’s recent performance shows its demand has slowed as its revenue was flat over the last two years. 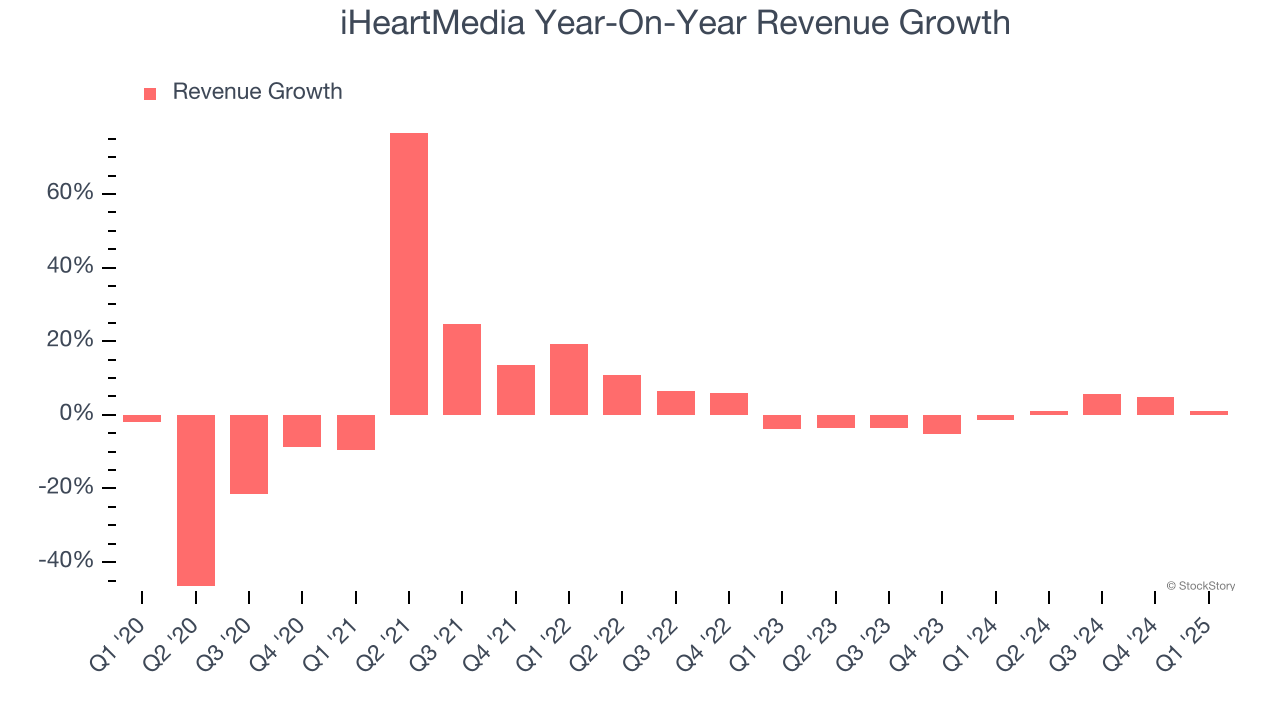
iHeartMedia also breaks out the revenue for its three most important segments: Multiplatform, Digital Audio, and Services, which are 58.6%, 34.4%, and 7.4% of revenue. Over the last two years, iHeartMedia’s Multiplatform revenue (broadcasting, networks, events) averaged 4.1% year-on-year declines, but its Digital Audio (podcasting) and Services (media representation) revenues averaged 8.2% and 4.8% growth.
This quarter, iHeartMedia reported modest year-on-year revenue growth of 1% but beat Wall Street’s estimates by 2.6%. Company management is currently guiding for a 2.5% year-on-year decline in sales next quarter.
Looking further ahead, sell-side analysts expect revenue to remain flat over the next 12 months. This projection is underwhelming and implies its newer products and services will not accelerate its top-line performance yet.
Software is eating the world and there is virtually no industry left that has been untouched by it. That drives increasing demand for tools helping software developers do their jobs, whether it be monitoring critical cloud infrastructure, integrating audio and video functionality, or ensuring smooth content streaming. Click here to access a free report on our 3 favorite stocks to play this generational megatrend.
Operating Margin
iHeartMedia’s operating margin has risen over the last 12 months, but it still averaged negative 20.2% over the last two years. This is due to its large expense base and inefficient cost structure.

iHeartMedia’s operating margin was negative 3.2% this quarter. The company's consistent lack of profits raise a flag.
Earnings Per Share
Revenue trends explain a company’s historical growth, but the long-term change in earnings per share (EPS) points to the profitability of that growth – for example, a company could inflate its sales through excessive spending on advertising and promotions.
Sadly for iHeartMedia, its EPS declined by 15.8% annually over the last five years while its revenue grew by 1%. However, its operating margin actually expanded during this time, telling us that non-fundamental factors such as interest expenses and taxes affected its ultimate earnings.

In Q1, iHeartMedia reported EPS at $1.84, up from negative $0.12 in the same quarter last year. This print easily cleared analysts’ estimates, and shareholders should be content with the results. We also like to analyze expected EPS growth based on Wall Street analysts’ consensus projections, but there is insufficient data.
Key Takeaways from iHeartMedia’s Q1 Results
We were impressed by how significantly iHeartMedia blew past analysts’ EPS expectations this quarter. We were also happy its revenue outperformed Wall Street’s estimates. On the other hand, its revenue and EBITDA guidance for next quarter missed. Zooming out, we think this was a mixed quarter. The market seemed to be hoping for more, and the stock traded down 3.9% to $1.22 immediately following the results.
So do we think iHeartMedia is an attractive buy at the current price? The latest quarter does matter, but not nearly as much as longer-term fundamentals and valuation, when deciding if the stock is a buy. We cover that in our actionable full research report which you can read here, it’s free.