Over the last six months, Lululemon shares have sunk to $280.25, producing a disappointing 12.7% loss - worse than the S&P 500’s 5.5% drop. This may have investors wondering how to approach the situation.
Following the drawdown, is now an opportune time to buy LULU? Find out in our full research report, it’s free.
Why Is LULU a Good Business?
Originally serving yogis and hockey players, Lululemon (NASDAQ: LULU) is a designer, distributor, and retailer of athletic apparel for men and women.
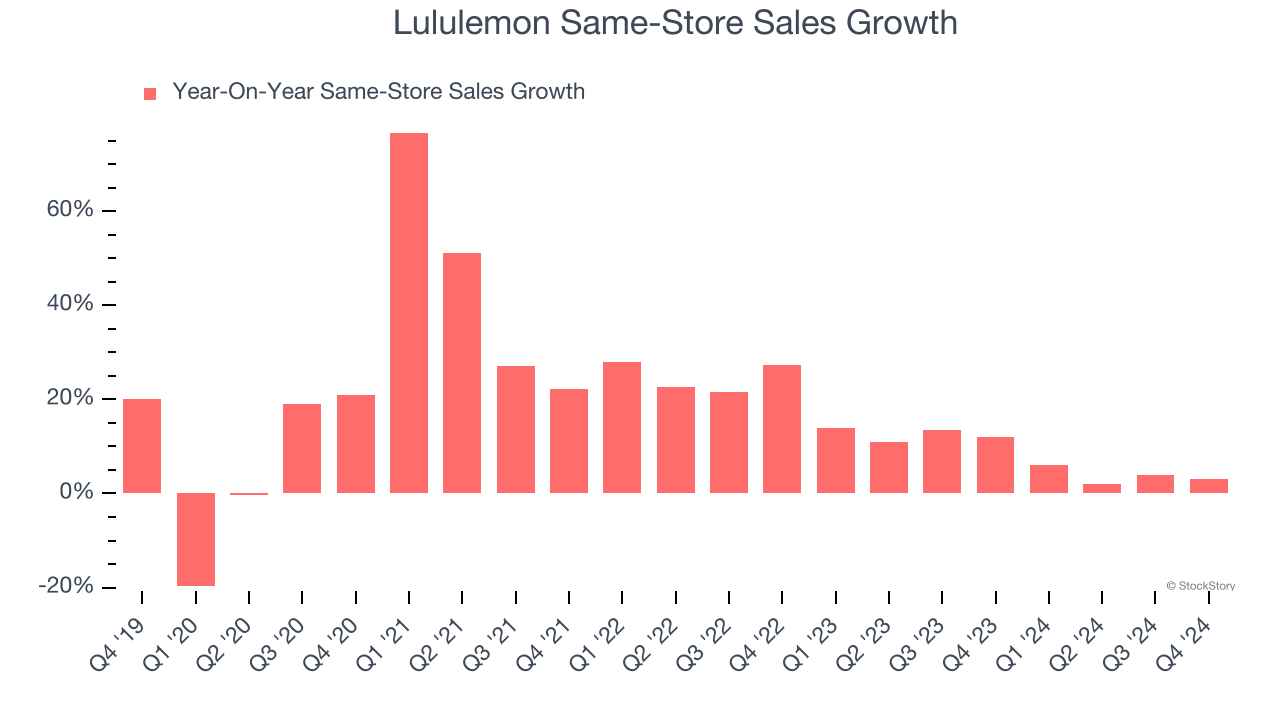
1. Surging Same-Store Sales Show Increasing Demand
Same-store sales is a key performance indicator used to measure organic growth at brick-and-mortar shops for at least a year.
Lululemon has been one of the most successful retailers over the last two years thanks to skyrocketing demand within its existing locations. On average, the company has posted exceptional year-on-year same-store sales growth of 8.2%.
2. Elite Gross Margin Powers Best-In-Class Business Model
Gross profit margins are an important measure of a retailer’s pricing power, product differentiation, and negotiating leverage.
Lululemon has best-in-class unit economics for a retailer, enabling it to invest in areas such as marketing and talent. As you can see below, it averaged an elite 58.8% gross margin over the last two years. That means Lululemon only paid its suppliers $41.21 for every $100 in revenue. 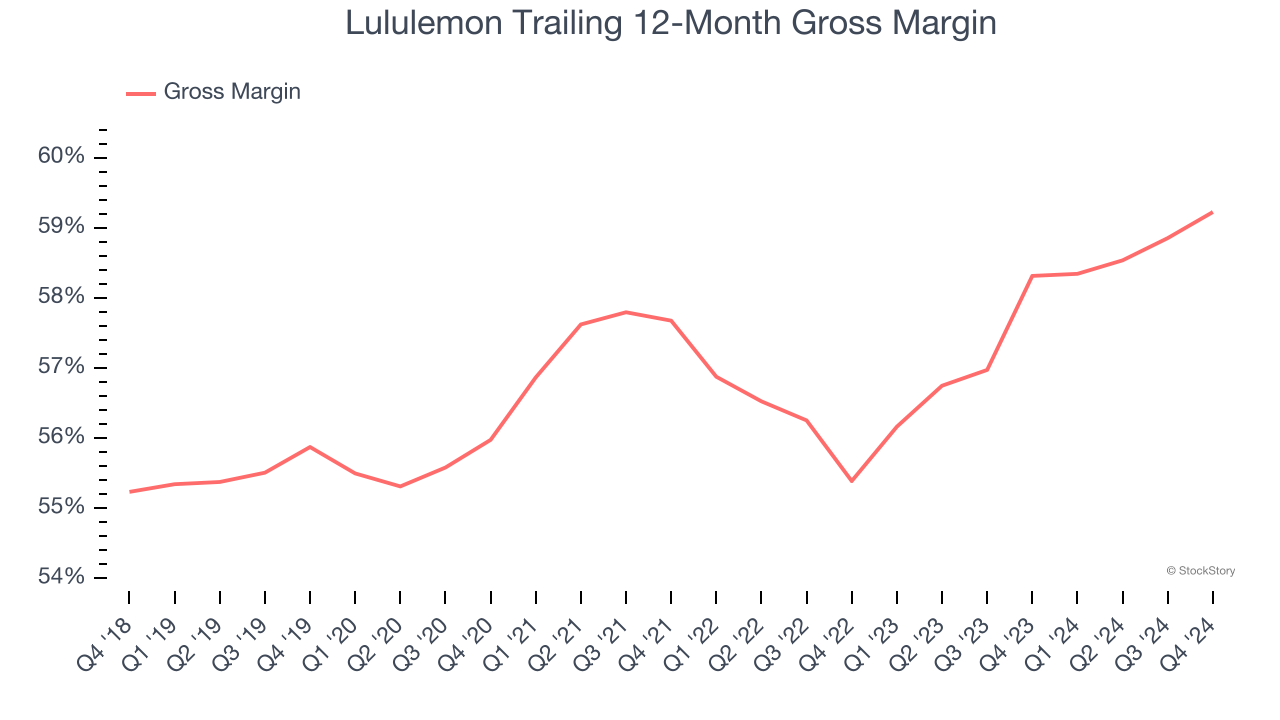
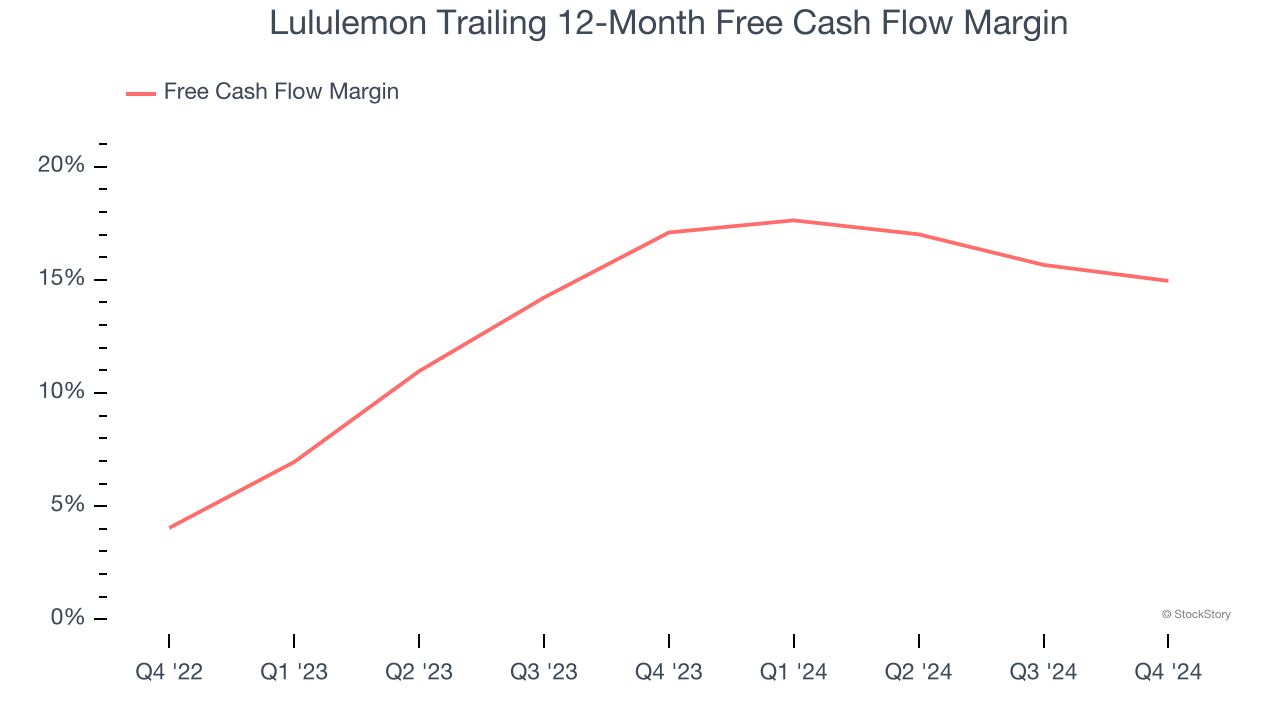
3. Excellent Free Cash Flow Margin Boosts Reinvestment Potential
If you’ve followed StockStory for a while, you know we emphasize free cash flow. Why, you ask? We believe that in the end, cash is king, and you can’t use accounting profits to pay the bills.
Lululemon has shown terrific cash profitability, driven by its lucrative business model that enables it to reinvest, return capital to investors, and stay ahead of the competition. The company’s free cash flow margin was among the best in the consumer retail sector, averaging 16% over the last two years.
Final Judgment
These are just a few reasons why we're bullish on Lululemon. With the recent decline, the stock trades at 18.2× forward P/E (or $280.25 per share). Is now the time to initiate a position? See for yourself in our in-depth research report, it’s free.
Stocks That Overcame Trump’s 2018 Tariffs
The market surged in 2024 and reached record highs after Donald Trump’s presidential victory in November, but questions about new economic policies are adding much uncertainty for 2025.
While the crowd speculates what might happen next, we’re homing in on the companies that can succeed regardless of the political or macroeconomic environment. Put yourself in the driver’s seat and build a durable portfolio by checking out our Top 9 Market-Beating Stocks. This is a curated list of our High Quality stocks that have generated a market-beating return of 176% over the last five years.
Stocks that made our list in 2020 include now familiar names such as Nvidia (+1,545% between March 2020 and March 2025) as well as under-the-radar businesses like the once-small-cap company Comfort Systems (+782% five-year return). Find your next big winner with StockStory today.