Golf entertainment and gear company Topgolf Callaway (NYSE: MODG) reported Q1 CY2025 results topping the market’s revenue expectations, but sales fell by 4.5% year on year to $1.09 billion. On the other hand, next quarter’s revenue guidance of $1.1 billion was less impressive, coming in 2.5% below analysts’ estimates. Its non-GAAP profit of $0.11 per share was significantly above analysts’ consensus estimates.
Is now the time to buy Topgolf Callaway? Find out by accessing our full research report, it’s free.
Topgolf Callaway (MODG) Q1 CY2025 Highlights:
- Revenue: $1.09 billion vs analyst estimates of $1.07 billion (4.5% year-on-year decline, 2.2% beat)
- Adjusted EPS: $0.11 vs analyst estimates of -$0.06 (significant beat)
- Adjusted EBITDA: $167.3 million vs analyst estimates of $130.2 million (15.3% margin, 28.5% beat)
- The company reconfirmed its revenue guidance for the full year of $4.09 billion at the midpoint
- EBITDA guidance for the full year is $270 million at the midpoint, below analyst estimates of $454.6 million
- Operating Margin: 6.1%, in line with the same quarter last year
- Free Cash Flow was -$155.1 million compared to -$138.7 million in the same quarter last year
- Market Capitalization: $1.35 billion
"We are pleased with our first quarter results as we met or beat our plan in all segments of our business," commented Chip Brewer, President and CEO.
Company Overview
Formed between the merger of Callaway and Topgolf, Topgolf Callaway (NYSE: MODG) sells golf equipment and operates technology-driven golf entertainment venues.
Sales Growth
Examining a company’s long-term performance can provide clues about its quality. Any business can put up a good quarter or two, but the best consistently grow over the long haul. Thankfully, Topgolf Callaway’s 20.8% annualized revenue growth over the last five years was solid. Its growth beat the average consumer discretionary company and shows its offerings resonate with customers.

We at StockStory place the most emphasis on long-term growth, but within consumer discretionary, a stretched historical view may miss a company riding a successful new product or trend. Topgolf Callaway’s recent performance shows its demand has slowed as its revenue was flat over the last two years. Note that COVID hurt Topgolf Callaway’s business in 2020 and part of 2021, and it bounced back in a big way thereafter. 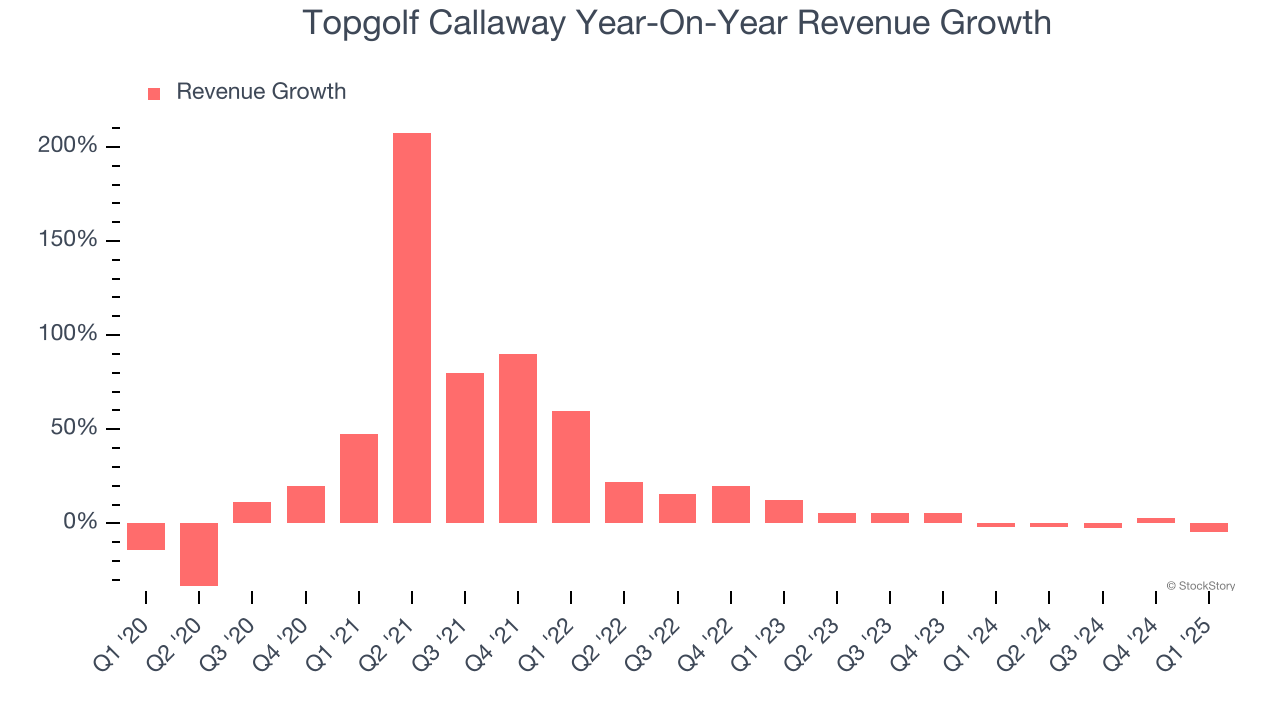
This quarter, Topgolf Callaway’s revenue fell by 4.5% year on year to $1.09 billion but beat Wall Street’s estimates by 2.2%. Company management is currently guiding for a 5.4% year-on-year decline in sales next quarter.
Looking further ahead, sell-side analysts expect revenue to decline by 2.7% over the next 12 months, a deceleration versus the last two years. This projection doesn't excite us and implies its products and services will face some demand challenges.
Here at StockStory, we certainly understand the potential of thematic investing. Diverse winners from Microsoft (MSFT) to Alphabet (GOOG), Coca-Cola (KO) to Monster Beverage (MNST) could all have been identified as promising growth stories with a megatrend driving the growth. So, in that spirit, we’ve identified a relatively under-the-radar profitable growth stock benefiting from the rise of AI, available to you FREE via this link.
Operating Margin
Topgolf Callaway’s operating margin has been trending down over the last 12 months and averaged negative 12.2% over the last two years. Unprofitable, high-growth companies warrant extra scrutiny, especially if their margins fall because they’re spending loads of money to stay relevant, an unsustainable practice.
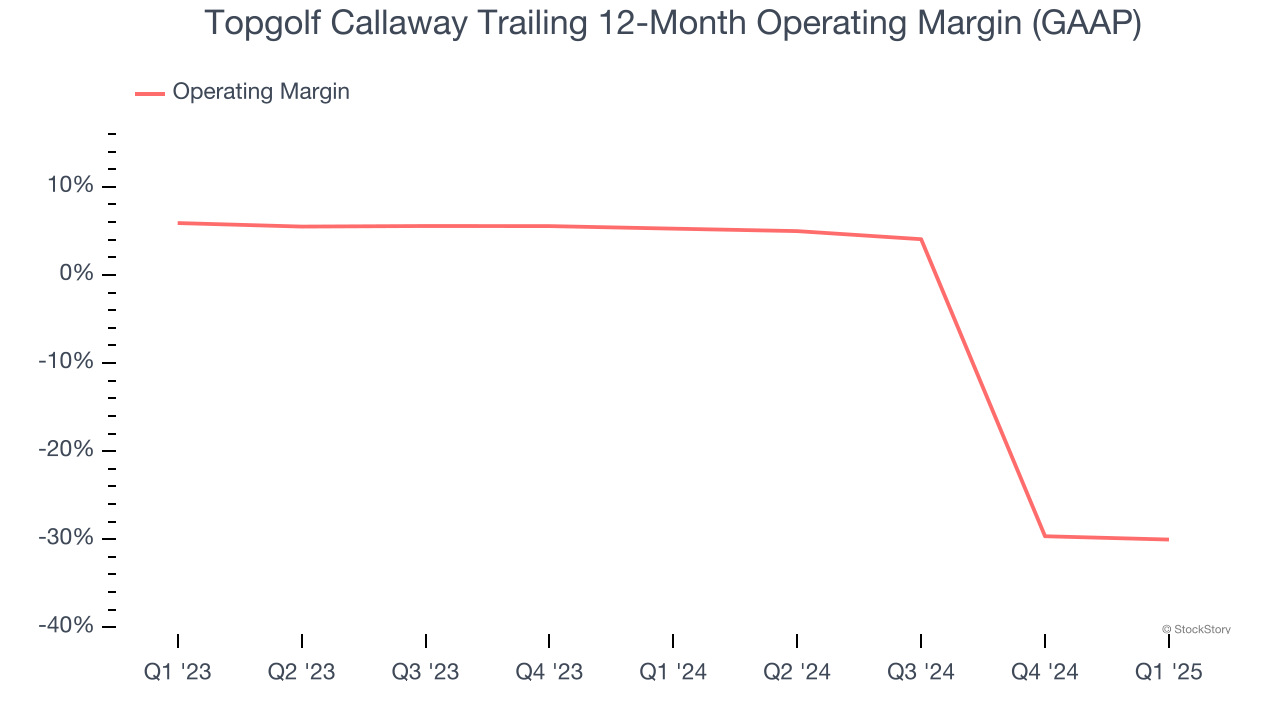
In Q1, Topgolf Callaway generated an operating profit margin of 6.1%, in line with the same quarter last year. This indicates the company’s overall cost structure has been relatively stable.
Earnings Per Share
Revenue trends explain a company’s historical growth, but the long-term change in earnings per share (EPS) points to the profitability of that growth – for example, a company could inflate its sales through excessive spending on advertising and promotions.
Sadly for Topgolf Callaway, its EPS declined by 22.3% annually over the last five years while its revenue grew by 20.8%. This tells us the company became less profitable on a per-share basis as it expanded.
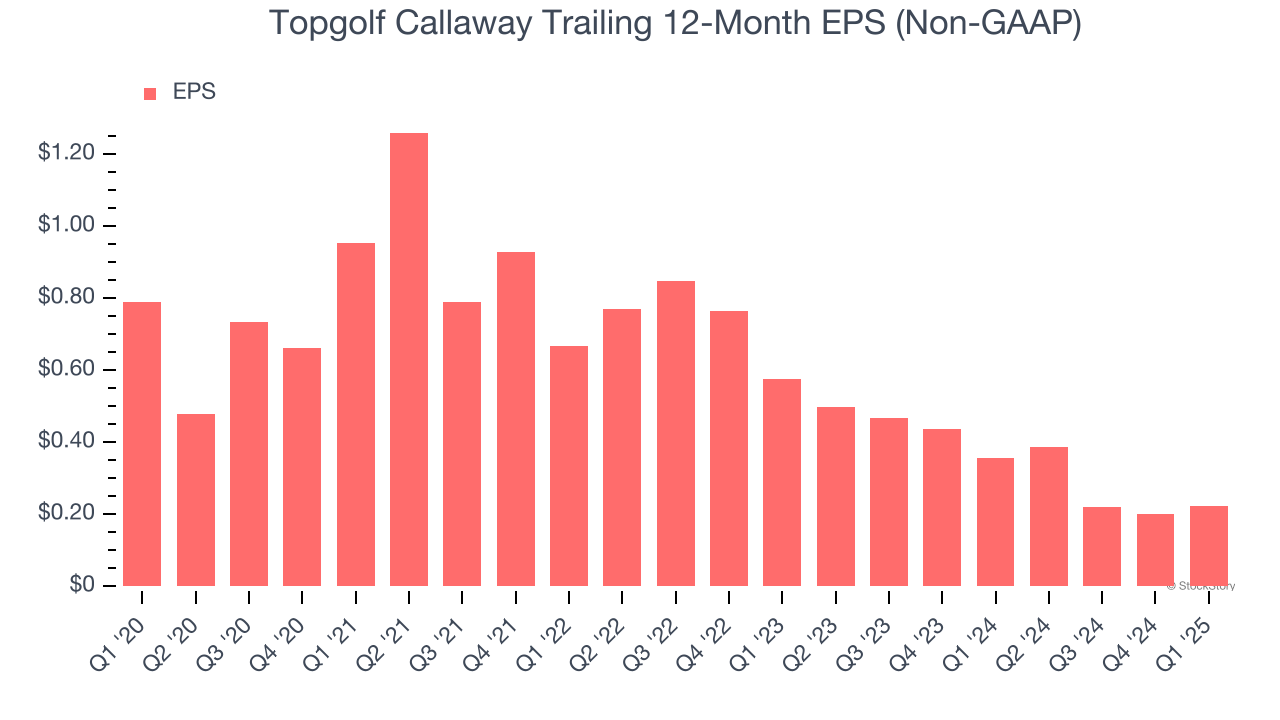
In Q1, Topgolf Callaway reported EPS at $0.11, up from $0.09 in the same quarter last year. This print easily cleared analysts’ estimates, and shareholders should be content with the results. Over the next 12 months, Wall Street expects Topgolf Callaway to perform poorly. Analysts forecast its full-year EPS of $0.22 will invert to negative negative $0.52.
Key Takeaways from Topgolf Callaway’s Q1 Results
We were impressed by how significantly Topgolf Callaway blew past analysts’ revenue, EPS, and EBITDA expectations this quarter. On the other hand, its full-year EBITDA guidance fell short of Wall Street’s estimates. Overall, this was a mixed quarter. The stock traded up 4.2% to $8.25 immediately following the results.
Is Topgolf Callaway an attractive investment opportunity right now? What happened in the latest quarter matters, but not as much as longer-term business quality and valuation, when deciding whether to invest in this stock. We cover that in our actionable full research report which you can read here, it’s free.