
Application performance monitoring software provider Dynatrace (NYSE: DT) reported Q1 CY2025 results beating Wall Street’s revenue expectations, with sales up 16.9% year on year to $445.2 million. On top of that, next quarter’s revenue guidance ($467.5 million at the midpoint) was surprisingly good and 3% above what analysts were expecting. Its non-GAAP profit of $0.33 per share was 9.1% above analysts’ consensus estimates.
Is now the time to buy Dynatrace? Find out by accessing our full research report, it’s free.
Dynatrace (DT) Q1 CY2025 Highlights:
- Revenue: $445.2 million vs analyst estimates of $434.7 million (16.9% year-on-year growth, 2.4% beat)
- Adjusted EPS: $0.33 vs analyst estimates of $0.30 (9.1% beat)
- Adjusted Operating Income: $117.9 million vs analyst estimates of $108.2 million (26.5% margin, 8.9% beat)
- Management’s revenue guidance for the upcoming financial year 2026 is $1.96 billion at the midpoint, beating analyst estimates by 1.1% and implying 15.2% growth (vs 18.8% in FY2025)
- Adjusted EPS guidance for the upcoming financial year 2026 is $1.58 at the midpoint, beating analyst estimates by 2.7%
- Operating Margin: 9.6%, up from 6.1% in the same quarter last year
- Free Cash Flow Margin: 32.7%, up from 8.6% in the previous quarter
- Annual Recurring Revenue: $1.73 billion at quarter end, up 15.3% year on year
- Billings: $704.5 million at quarter end, up 10.9% year on year
- Market Capitalization: $15.13 billion
"Dynatrace delivered a strong finish to fiscal 2025. Our fourth quarter results exceeded guidance on all of our key operating metrics, fueled by broad consumption growth across the platform," said Rick McConnell, Chief Executive Officer of Dynatrace.
Company Overview
Founded in Austria in 2005, Dynatrace (NYSE: DT) provides companies with software that allows them to monitor the performance of their full technology stack, from software applications to the infrastructure they run on.
Sales Growth
A company’s long-term performance is an indicator of its overall quality. Any business can experience short-term success, but top-performing ones enjoy sustained growth for years. Over the last three years, Dynatrace grew its sales at a decent 22.3% compounded annual growth rate. Its growth was slightly above the average software company and shows its offerings resonate with customers.
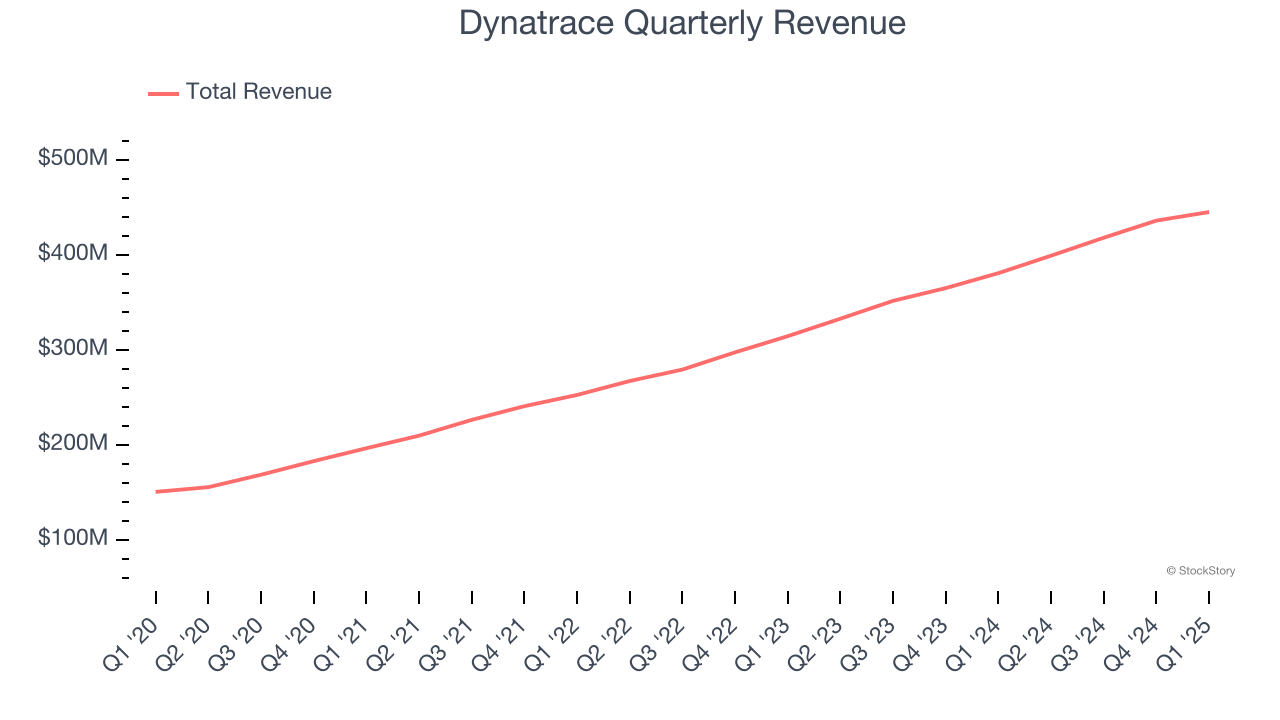
This quarter, Dynatrace reported year-on-year revenue growth of 16.9%, and its $445.2 million of revenue exceeded Wall Street’s estimates by 2.4%. Company management is currently guiding for a 17.1% year-on-year increase in sales next quarter.
Looking further ahead, sell-side analysts expect revenue to grow 13.6% over the next 12 months, a deceleration versus the last three years. Still, this projection is admirable and suggests the market sees success for its products and services.
Unless you’ve been living under a rock, it should be obvious by now that generative AI is going to have a huge impact on how large corporations do business. While Nvidia and AMD are trading close to all-time highs, we prefer a lesser-known (but still profitable) stock benefiting from the rise of AI. Click here to access our free report one of our favorites growth stories.
Annual Recurring Revenue
While reported revenue for a software company can include low-margin items like implementation fees, annual recurring revenue (ARR) is a sum of the next 12 months of contracted revenue purely from software subscriptions, or the high-margin, predictable revenue streams that make SaaS businesses so valuable.
Dynatrace’s ARR punched in at $1.73 billion in Q1, and over the last four quarters, its growth was solid as it averaged 17.6% year-on-year increases. This performance aligned with its total sales growth, reflecting the company’s ability to maintain strong customer relationships and secure longer-term commitments. Its growth also contributes positively to Dynatrace’s predictability and valuation, as investors typically prefer businesses with recurring revenue. 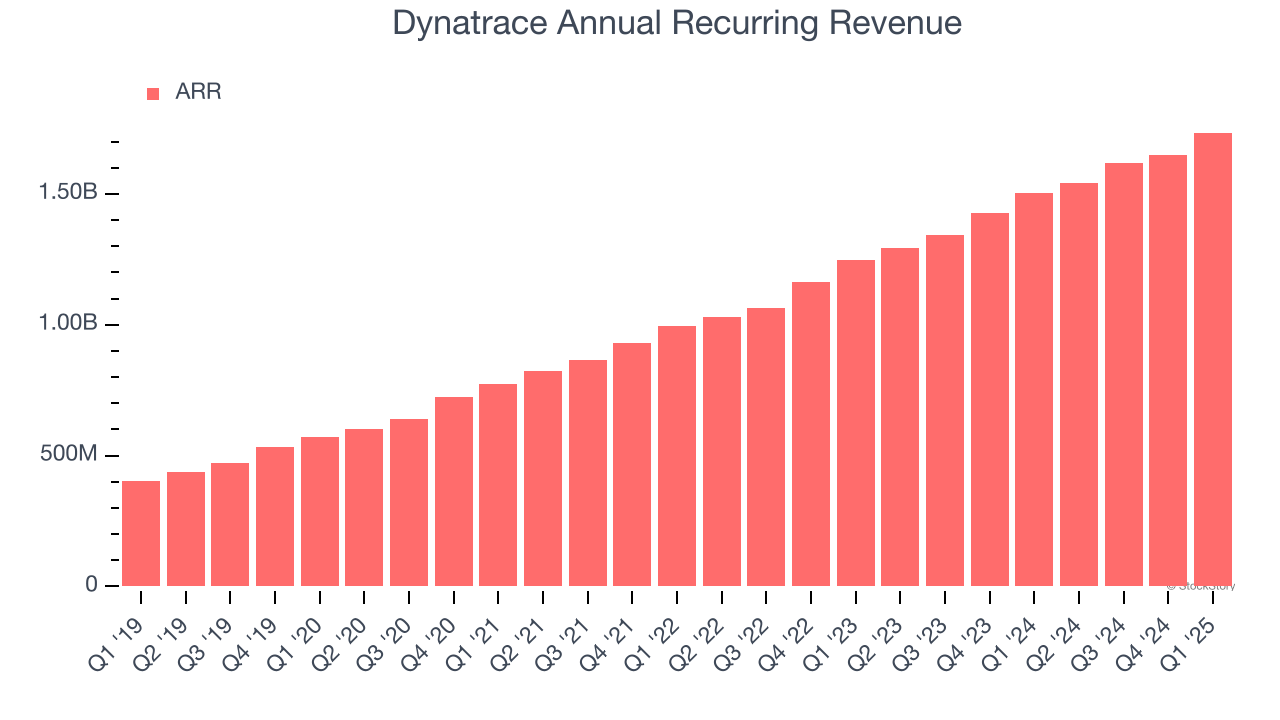
Customer Acquisition Efficiency
The customer acquisition cost (CAC) payback period measures the months a company needs to recoup the money spent on acquiring a new customer. This metric helps assess how quickly a business can break even on its sales and marketing investments.
Dynatrace is efficient at acquiring new customers, and its CAC payback period checked in at 37.6 months this quarter. The company’s relatively fast recovery of its customer acquisition costs gives it the option to accelerate growth by increasing its sales and marketing investments. 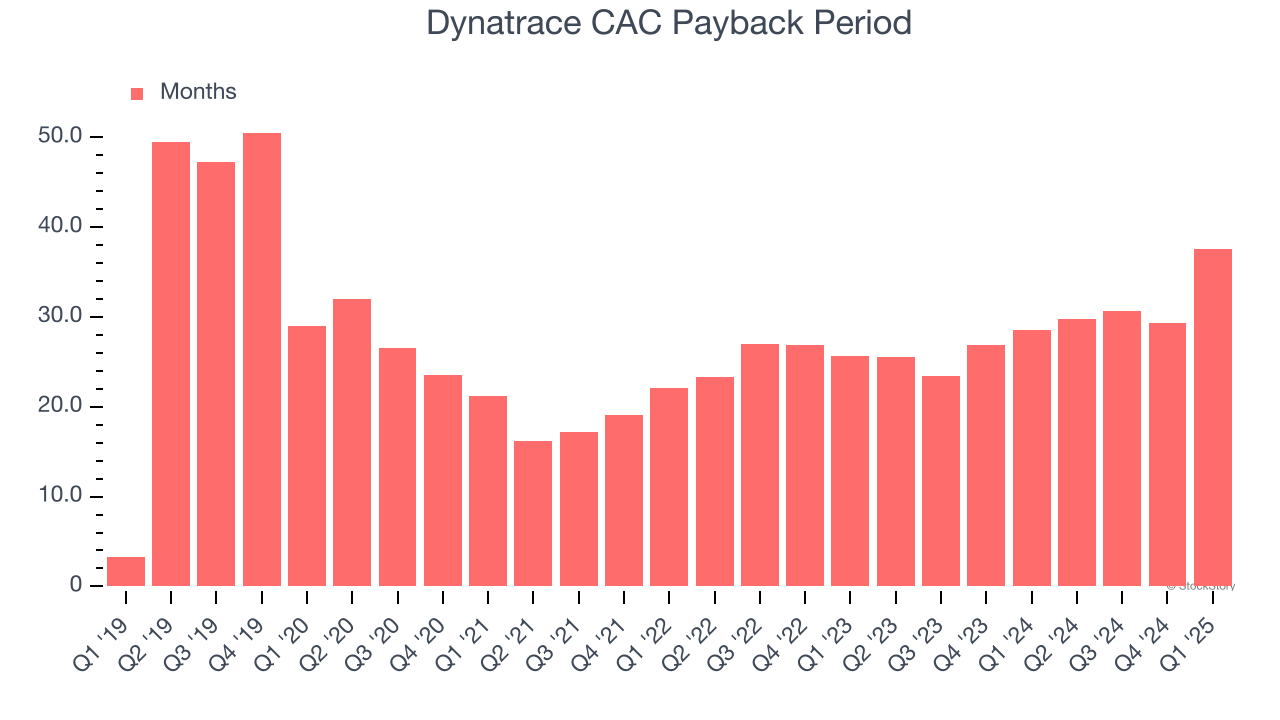
Key Takeaways from Dynatrace’s Q1 Results
We were impressed by Dynatrace’s optimistic EPS guidance for next quarter, which blew past analysts’ expectations. We were also glad its full-year EPS guidance exceeded Wall Street’s estimates. On the other hand, its billings slightly missed. Overall, we think this was a decent quarter with some key metrics above expectations. The stock traded up 10.9% to $56 immediately following the results.
Dynatrace had an encouraging quarter, but one earnings result doesn’t necessarily make the stock a buy. Let’s see if this is a good investment. If you’re making that decision, you should consider the bigger picture of valuation, business qualities, as well as the latest earnings. We cover that in our actionable full research report which you can read here, it’s free.