
Medical equipment and services company Steris (NYSE: STE). met Wall Street’s revenue expectations in Q1 CY2025, with sales up 4.3% year on year to $1.48 billion. Its non-GAAP profit of $2.74 per share was 5.4% above analysts’ consensus estimates.
Is now the time to buy STERIS? Find out by accessing our full research report, it’s free.
STERIS (STE) Q1 CY2025 Highlights:
- Revenue: $1.48 billion vs analyst estimates of $1.47 billion (4.3% year-on-year growth, in line)
- Adjusted EPS: $2.74 vs analyst estimates of $2.60 (5.4% beat)
- Adjusted EPS guidance for the upcoming financial year 2026 is $10.03 at the midpoint, beating analyst estimates by 1.4%
- Operating Margin: 14.6%, in line with the same quarter last year
- Free Cash Flow Margin: 12.8%, up from 11.5% in the same quarter last year
- Constant Currency Revenue rose 5.9% year on year, in line with the same quarter last year
- Market Capitalization: $22.71 billion
Company Overview
With a mission critical role in preventing healthcare-associated infections, STERIS (NYSE: STE) provides infection prevention products, sterilization services, and medical equipment that help healthcare facilities and life science companies maintain sterile environments.
Sales Growth
Examining a company’s long-term performance can provide clues about its quality. Any business can put up a good quarter or two, but many enduring ones grow for years. Over the last five years, STERIS grew its sales at a solid 12.5% compounded annual growth rate. Its growth beat the average healthcare company and shows its offerings resonate with customers.

Long-term growth is the most important, but within healthcare, a half-decade historical view may miss new innovations or demand cycles. STERIS’s annualized revenue growth of 9.7% over the last two years is below its five-year trend, but we still think the results were respectable. 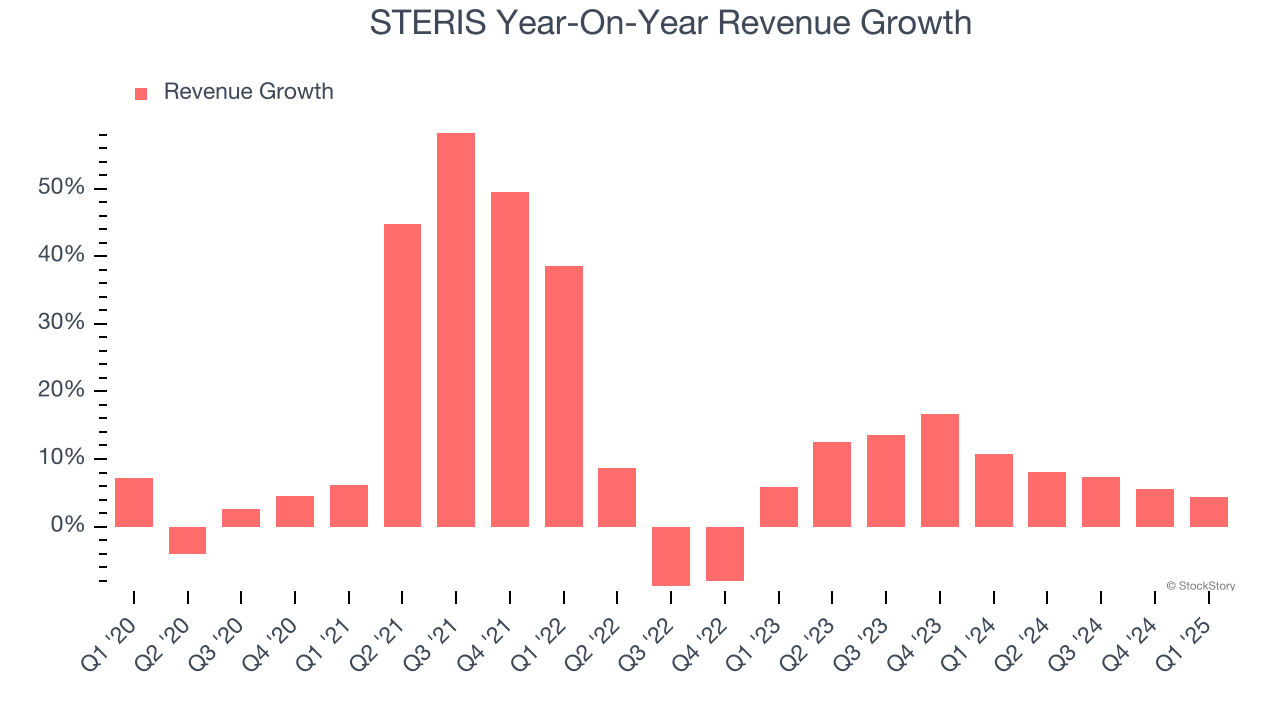
We can better understand the company’s sales dynamics by analyzing its constant currency revenue, which excludes currency movements that are outside their control and not indicative of demand. Over the last two years, its constant currency sales averaged 7.6% year-on-year growth. Because this number is lower than its normal revenue growth, we can see that foreign exchange rates have boosted STERIS’s performance. 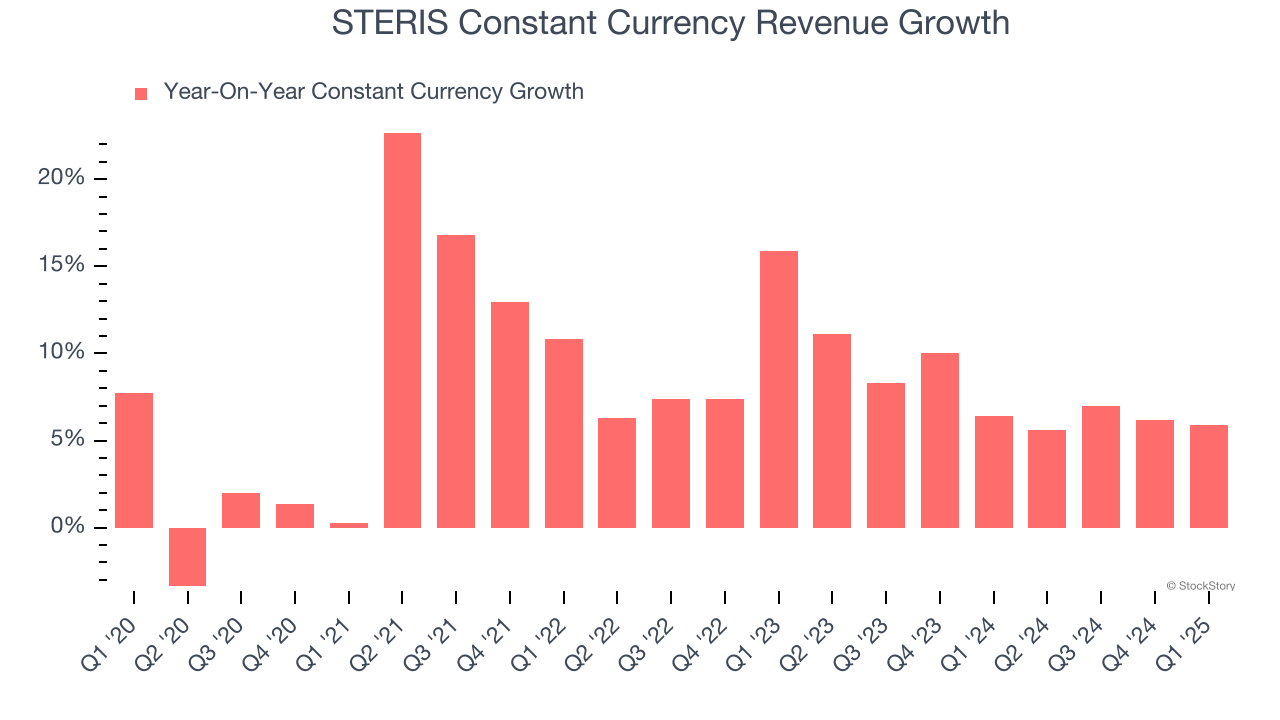
This quarter, STERIS grew its revenue by 4.3% year on year, and its $1.48 billion of revenue was in line with Wall Street’s estimates.
Looking ahead, sell-side analysts expect revenue to grow 5.8% over the next 12 months, a deceleration versus the last two years. Despite the slowdown, this projection is above average for the sector and suggests the market is baking in some success for its newer products and services.
Unless you’ve been living under a rock, it should be obvious by now that generative AI is going to have a huge impact on how large corporations do business. While Nvidia and AMD are trading close to all-time highs, we prefer a lesser-known (but still profitable) stock benefiting from the rise of AI. Click here to access our free report one of our favorites growth stories.
Operating Margin
STERIS has done a decent job managing its cost base over the last five years. The company has produced an average operating margin of 12.9%, higher than the broader healthcare sector.
Analyzing the trend in its profitability, STERIS’s operating margin decreased by 1.8 percentage points over the last five years, but it rose by 9.8 percentage points on a two-year basis. Still, shareholders will want to see STERIS become more profitable in the future.
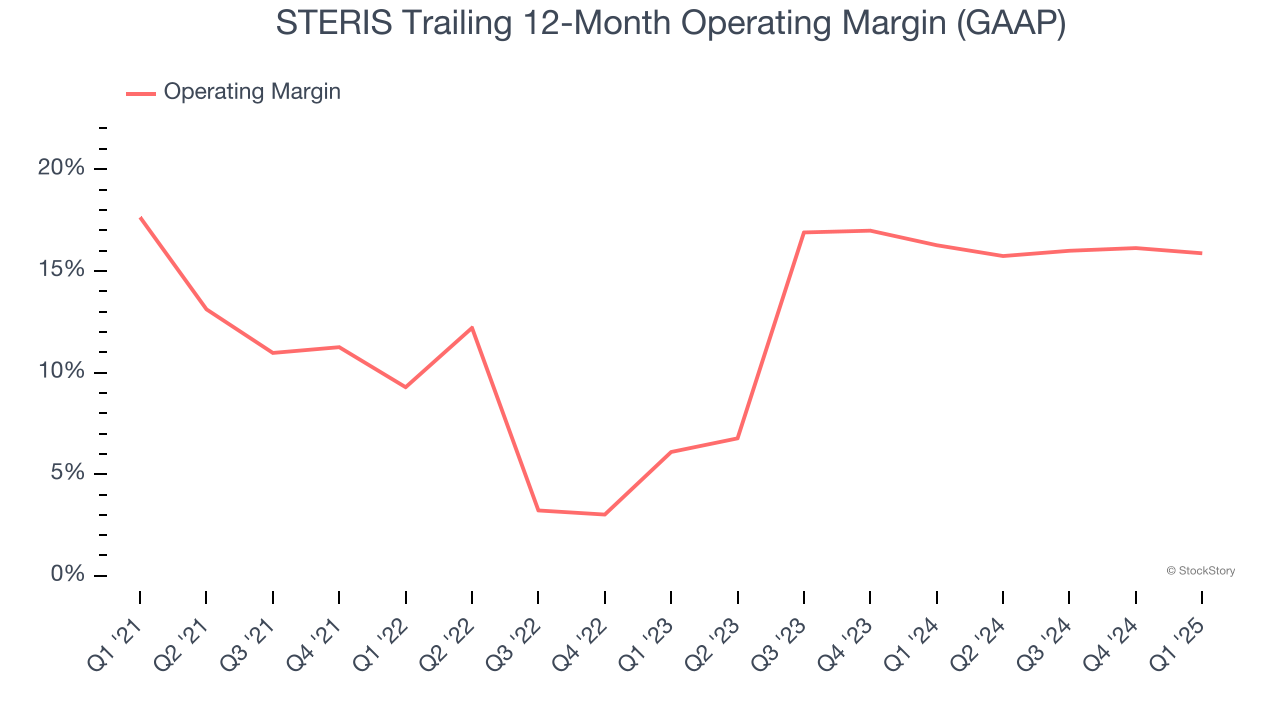
In Q1, STERIS generated an operating profit margin of 14.6%, in line with the same quarter last year. This indicates the company’s overall cost structure has been relatively stable.
Earnings Per Share
Revenue trends explain a company’s historical growth, but the long-term change in earnings per share (EPS) points to the profitability of that growth – for example, a company could inflate its sales through excessive spending on advertising and promotions.
STERIS’s EPS grew at a remarkable 10.6% compounded annual growth rate over the last five years. However, this performance was lower than its 12.5% annualized revenue growth, telling us the company became less profitable on a per-share basis as it expanded.
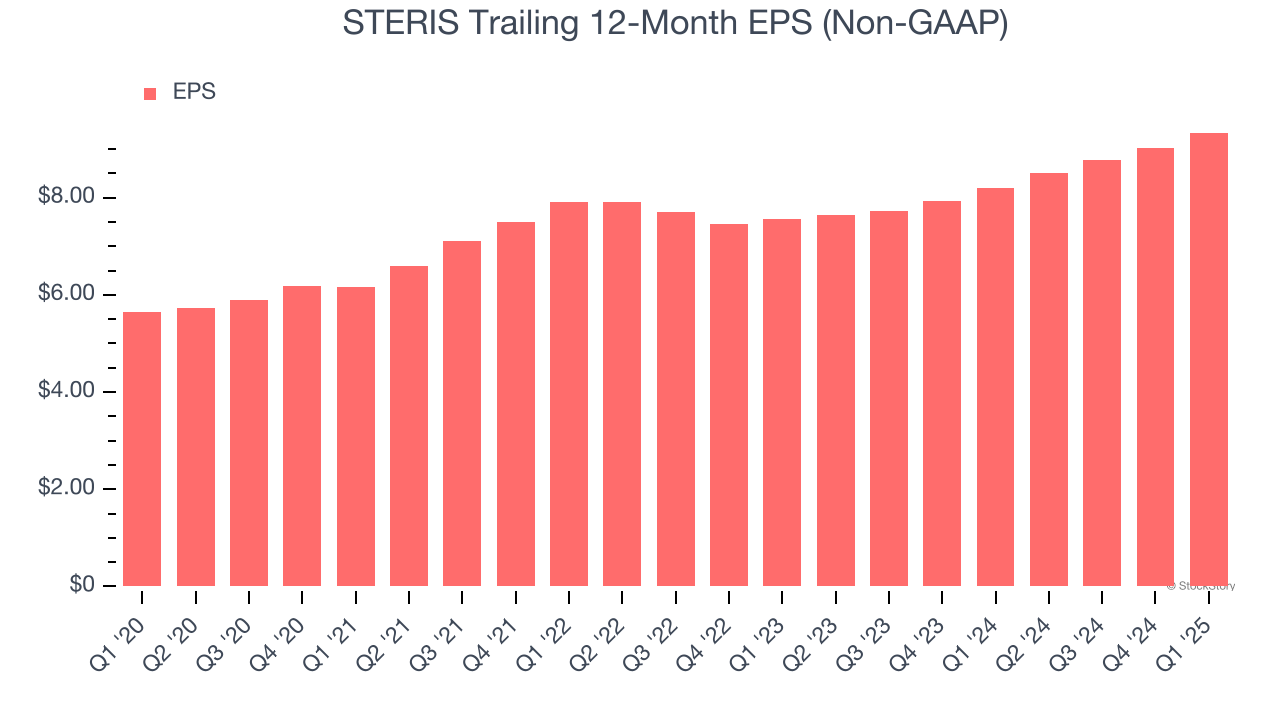
We can take a deeper look into STERIS’s earnings to better understand the drivers of its performance. As we mentioned earlier, STERIS’s operating margin was flat this quarter but declined by 1.8 percentage points over the last five years. Its share count also grew by 15.3%, meaning the company not only became less efficient with its operating expenses but also diluted its shareholders. 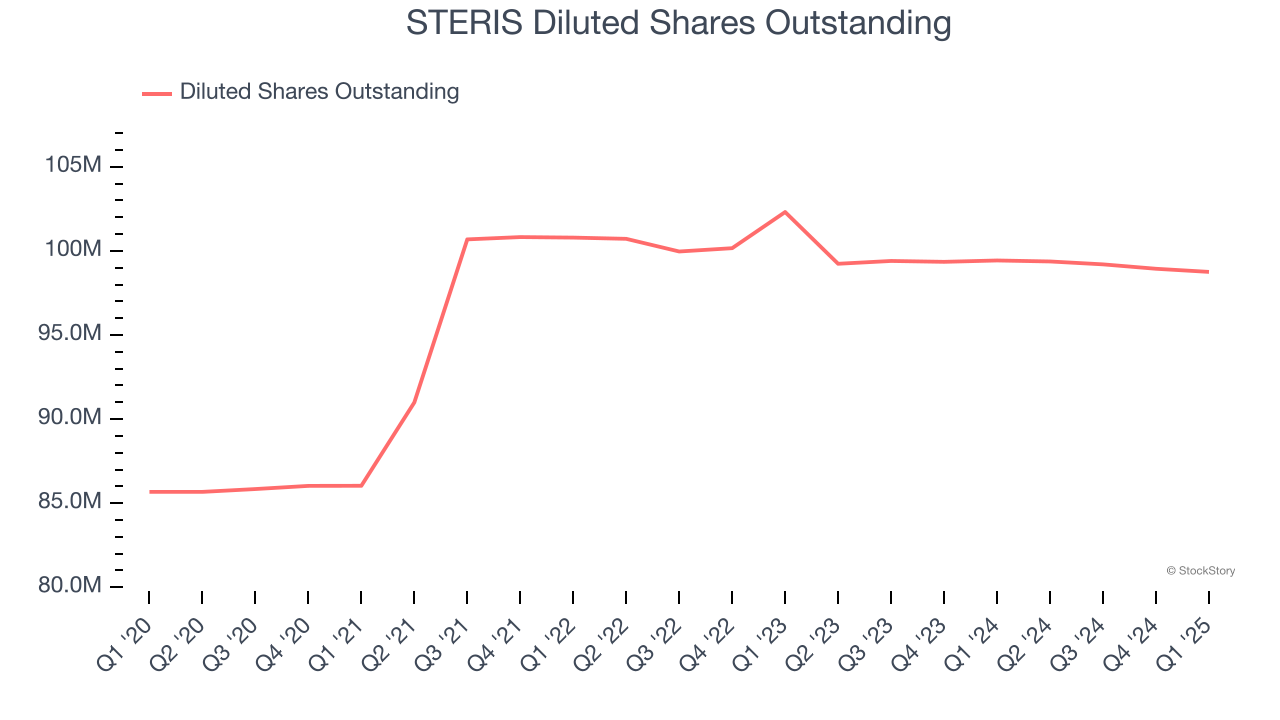
In Q1, STERIS reported EPS at $2.74, up from $2.41 in the same quarter last year. This print beat analysts’ estimates by 5.4%. Over the next 12 months, Wall Street expects STERIS’s full-year EPS of $9.34 to grow 6.9%.
Key Takeaways from STERIS’s Q1 Results
It was good to see STERIS narrowly top analysts’ full-year EPS guidance expectations this quarter. We were also happy this quarter's EPS outperformed Wall Street’s estimates. Overall, this print had some key positives. The stock traded up 3% to $234 immediately after reporting.
STERIS had an encouraging quarter, but one earnings result doesn’t necessarily make the stock a buy. Let’s see if this is a good investment. If you’re making that decision, you should consider the bigger picture of valuation, business qualities, as well as the latest earnings. We cover that in our actionable full research report which you can read here, it’s free.
