Semiconductor machinery manufacturer Applied Materials (NASDAQ: AMAT) met Wall Street’s revenue expectations in Q1 CY2025, with sales up 6.8% year on year to $7.1 billion. The company expects next quarter’s revenue to be around $7.2 billion, coming in 0.5% above analysts’ estimates. Its non-GAAP profit of $2.39 per share was 3.4% above analysts’ consensus estimates.
Is now the time to buy Applied Materials? Find out by accessing our full research report, it’s free.
Applied Materials (AMAT) Q1 CY2025 Highlights:
- Revenue: $7.1 billion vs analyst estimates of $7.13 billion (6.8% year-on-year growth, in line)
- Adjusted EPS: $2.39 vs analyst estimates of $2.31 (3.4% beat)
- Adjusted Operating Income: $2.18 billion vs analyst estimates of $2.12 billion (30.7% margin, 2.6% beat)
- Revenue Guidance for Q2 CY2025 is $7.2 billion at the midpoint, roughly in line with what analysts were expecting
- Adjusted EPS guidance for Q2 CY2025 is $2.35 at the midpoint, above analyst estimates of $2.31
- Operating Margin: 30.5%, up from 28.8% in the same quarter last year
- Free Cash Flow Margin: 14.9%, down from 17.1% in the same quarter last year
- Inventory Days Outstanding: 142, up from 136 in the previous quarter
- Market Capitalization: $141.5 billion
“Applied Materials’ broad capabilities and connected product portfolio are driving strong results in 2025 amidst a highly dynamic macro environment,” said Gary Dickerson, President and CEO.
Company Overview
Founded in 1967 as the first company to develop tools for other businesses in the semiconductor industry, Applied Materials (NASDAQ: AMAT) is the largest provider of semiconductor wafer fabrication equipment.
Sales Growth
A company’s long-term performance is an indicator of its overall quality. Even a bad business can shine for one or two quarters, but a top-tier one grows for years. Thankfully, Applied Materials’s 12.7% annualized revenue growth over the last five years was impressive. Its growth beat the average semiconductor company and shows its offerings resonate with customers, a helpful starting point for our analysis. Semiconductors are a cyclical industry, and long-term investors should be prepared for periods of high growth followed by periods of revenue contractions.
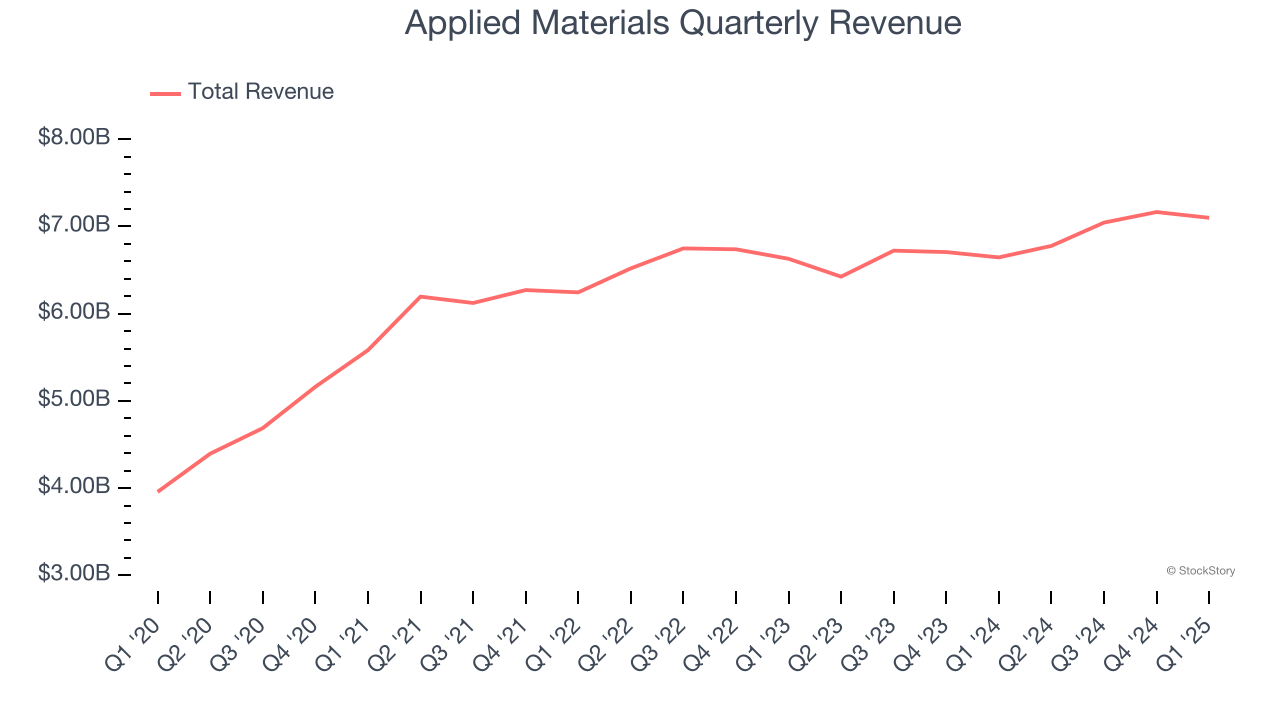
We at StockStory place the most emphasis on long-term growth, but within semiconductors, a half-decade historical view may miss new demand cycles or industry trends like AI. Applied Materials’s recent performance shows its demand has slowed significantly as its annualized revenue growth of 2.7% over the last two years was well below its five-year trend. 
This quarter, Applied Materials grew its revenue by 6.8% year on year, and its $7.1 billion of revenue was in line with Wall Street’s estimates. Beyond meeting estimates, this marks 5 straight quarters of growth, implying that Applied Materials is in the middle of its cycle - a typical upcycle generally lasts 8-10 quarters. Company management is currently guiding for a 6.2% year-on-year increase in sales next quarter.
Looking further ahead, sell-side analysts expect revenue to grow 4% over the next 12 months, similar to its two-year rate. Although this projection implies its newer products and services will fuel better top-line performance, it is still below average for the sector. At least the company is tracking well in other measures of financial health.
Unless you’ve been living under a rock, it should be obvious by now that generative AI is going to have a huge impact on how large corporations do business. While Nvidia and AMD are trading close to all-time highs, we prefer a lesser-known (but still profitable) stock benefiting from the rise of AI. Click here to access our free report one of our favorites growth stories.
Product Demand & Outstanding Inventory
Days Inventory Outstanding (DIO) is an important metric for chipmakers, as it reflects a business’ capital intensity and the cyclical nature of semiconductor supply and demand. In a tight supply environment, inventories tend to be stable, allowing chipmakers to exert pricing power. Steadily increasing DIO can be a warning sign that demand is weak, and if inventories continue to rise, the company may have to downsize production.
This quarter, Applied Materials’s DIO came in at 142, which is 3 more days than its five-year average, suggesting that the company’s inventory levels have grown slightly above the long-term average.

Key Takeaways from Applied Materials’s Q1 Results
It was encouraging to see Applied Materials beat analysts’ EPS and adjusted operating income estimates this quarter. On the other hand, its revenue was in line and its inventory levels slightly increased. Zooming out, we think this was a mixed quarter. The market seemed to be hoping for more, and the stock traded down 3.3% to $168.85 immediately after reporting.
So do we think Applied Materials is an attractive buy at the current price? What happened in the latest quarter matters, but not as much as longer-term business quality and valuation, when deciding whether to invest in this stock. We cover that in our actionable full research report which you can read here, it’s free.