
Pharmaceutical company Amneal Pharmaceuticals (NASDAQ: AMRX) missed Wall Street’s revenue expectations in Q1 CY2025, but sales rose 5.5% year on year to $695.4 million. On the other hand, the company’s full-year revenue guidance of $3.05 billion at the midpoint came in 0.8% above analysts’ estimates. Its non-GAAP profit of $0.21 per share was 43.2% above analysts’ consensus estimates.
Is now the time to buy Amneal? Find out by accessing our full research report, it’s free.
Amneal (AMRX) Q1 CY2025 Highlights:
- Revenue: $695.4 million vs analyst estimates of $720.2 million (5.5% year-on-year growth, 3.4% miss)
- Adjusted EPS: $0.21 vs analyst estimates of $0.15 (43.2% beat)
- Adjusted EBITDA: $170 million vs analyst estimates of $161.7 million (24.4% margin, 5.1% beat)
- The company reconfirmed its revenue guidance for the full year of $3.05 billion at the midpoint
- Management reiterated its full-year Adjusted EPS guidance of $0.68 at the midpoint
- EBITDA guidance for the full year is $662.5 million at the midpoint, in line with analyst expectations
- Operating Margin: 14.4%, up from -1.6% in the same quarter last year
- Free Cash Flow was -$5.75 million compared to -$13.61 million in the same quarter last year
- Market Capitalization: $2.43 billion
Company Overview
Founded in 2002 and growing into one of America's largest generic drug producers, Amneal Pharmaceuticals (NASDAQ: AMRX) develops, manufactures, and distributes generic medicines, specialty branded drugs, biosimilars, and injectable products for the U.S. healthcare market.
Sales Growth
A company’s long-term sales performance can indicate its overall quality. Even a bad business can shine for one or two quarters, but a top-tier one grows for years. Luckily, Amneal’s sales grew at a decent 11% compounded annual growth rate over the last five years. Its growth was slightly above the average healthcare company and shows its offerings resonate with customers.
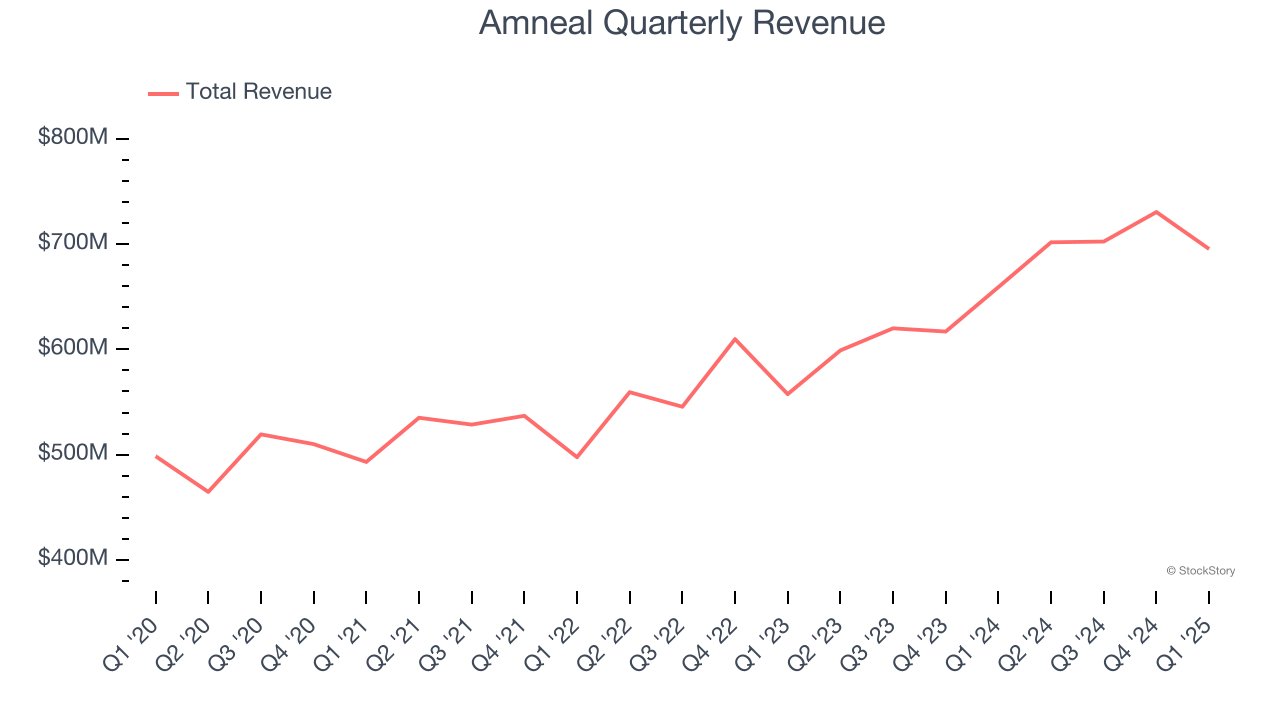
Long-term growth is the most important, but within healthcare, a half-decade historical view may miss new innovations or demand cycles. Amneal’s annualized revenue growth of 11.6% over the last two years aligns with its five-year trend, suggesting its demand was stable. 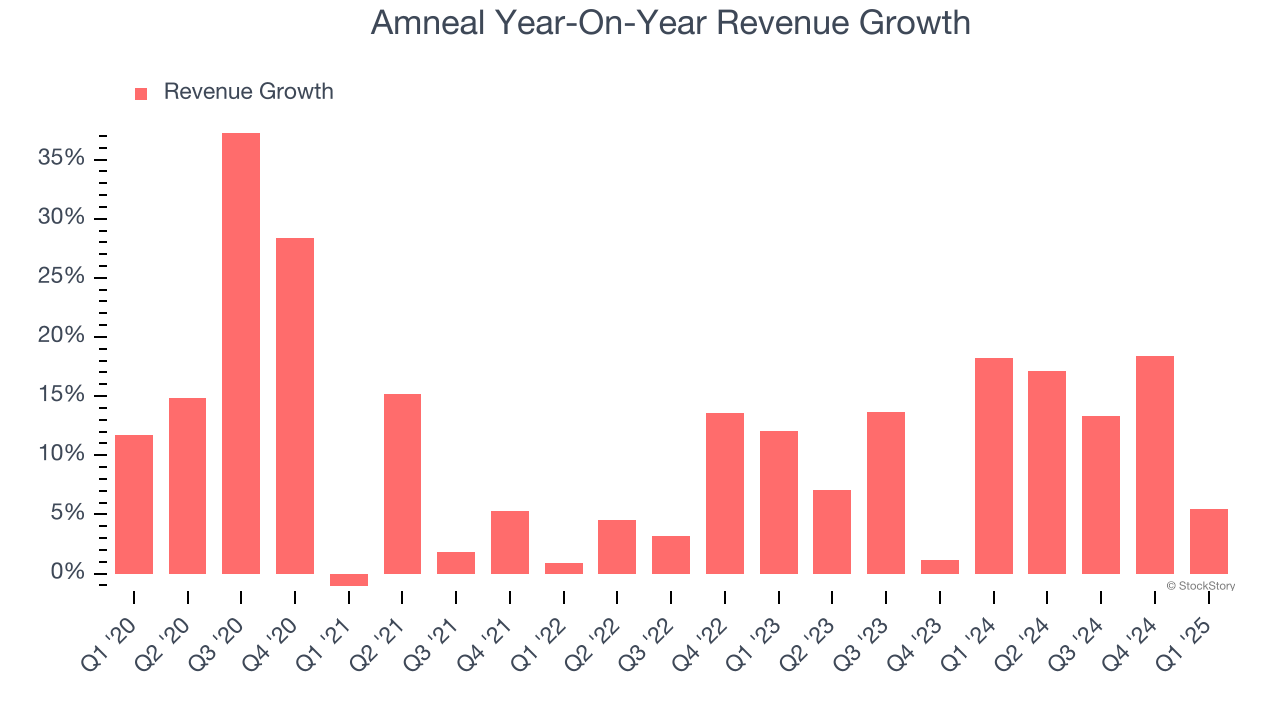
This quarter, Amneal’s revenue grew by 5.5% year on year to $695.4 million, missing Wall Street’s estimates.
Looking ahead, sell-side analysts expect revenue to grow 8.5% over the next 12 months, a deceleration versus the last two years. Despite the slowdown, this projection is noteworthy and indicates the market is baking in success for its products and services.
Here at StockStory, we certainly understand the potential of thematic investing. Diverse winners from Microsoft (MSFT) to Alphabet (GOOG), Coca-Cola (KO) to Monster Beverage (MNST) could all have been identified as promising growth stories with a megatrend driving the growth. So, in that spirit, we’ve identified a relatively under-the-radar profitable growth stock benefiting from the rise of AI, available to you FREE via this link.
Operating Margin
Amneal was profitable over the last five years but held back by its large cost base. Its average operating margin of 5.5% was weak for a healthcare business.
On the plus side, Amneal’s operating margin rose by 8.7 percentage points over the last five years, as its sales growth gave it operating leverage. This performance was mostly driven by its recent improvements as the company’s margin has increased by 16.4 percentage points on a two-year basis.
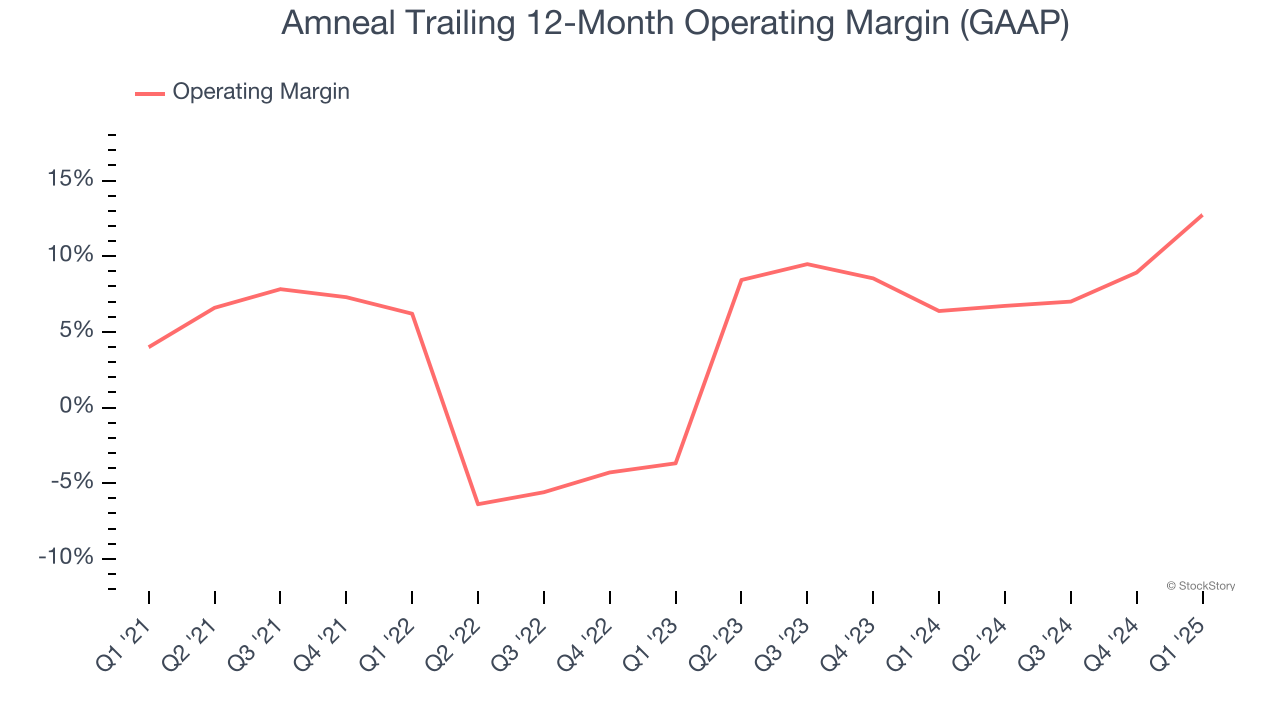
In Q1, Amneal generated an operating profit margin of 14.4%, up 16.1 percentage points year on year. This increase was a welcome development and shows it was more efficient.
Earnings Per Share
Revenue trends explain a company’s historical growth, but the long-term change in earnings per share (EPS) points to the profitability of that growth – for example, a company could inflate its sales through excessive spending on advertising and promotions.
Amneal’s EPS grew at a remarkable 9.7% compounded annual growth rate over the last five years. Despite its operating margin expansion during that time, this performance was lower than its 11% annualized revenue growth, telling us that non-fundamental factors such as interest and taxes affected its ultimate earnings.
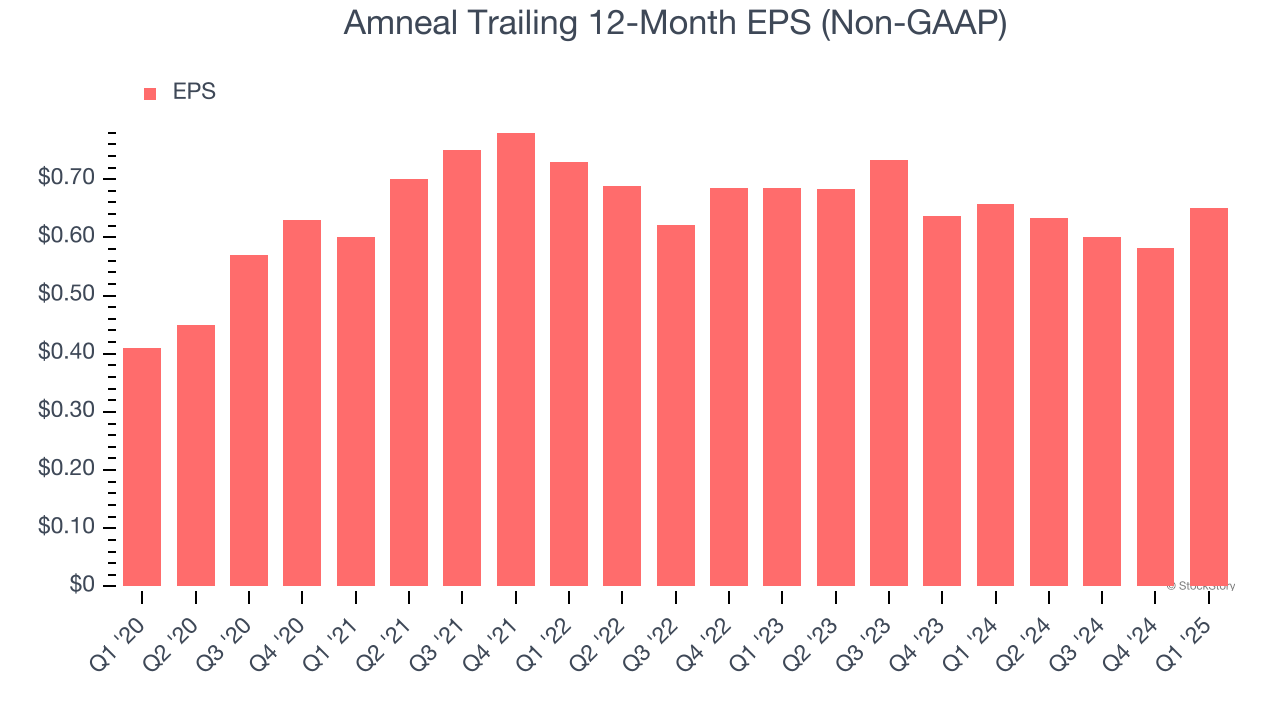
Diving into the nuances of Amneal’s earnings can give us a better understanding of its performance. A five-year view shows Amneal has diluted its shareholders, growing its share count by 119%. This dilution overshadowed its increased operating efficiency and has led to lower per share earnings. Taxes and interest expenses can also affect EPS but don’t tell us as much about a company’s fundamentals. 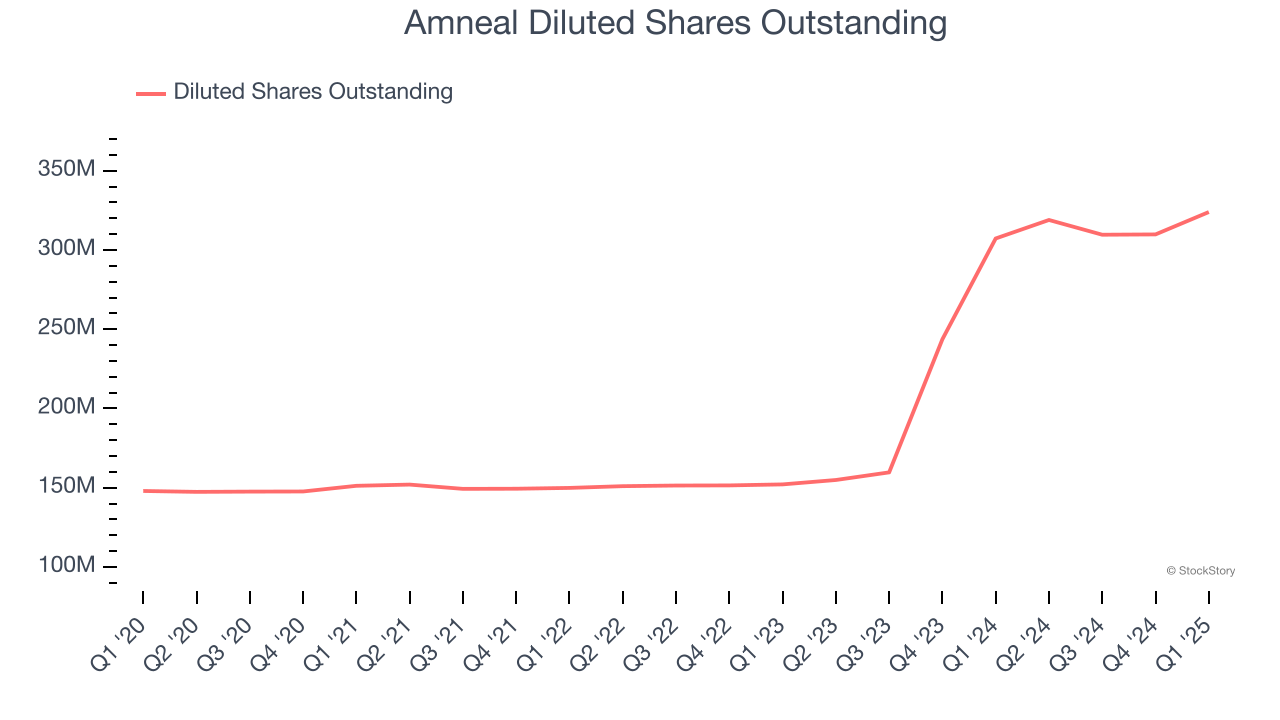
In Q1, Amneal reported EPS at $0.21, up from $0.14 in the same quarter last year. This print easily cleared analysts’ estimates, and shareholders should be content with the results. Over the next 12 months, Wall Street expects Amneal’s full-year EPS of $0.65 to grow 7.2%.
Key Takeaways from Amneal’s Q1 Results
We were impressed by how significantly Amneal blew past analysts’ EPS expectations this quarter. We were also glad its full-year revenue guidance slightly exceeded Wall Street’s estimates. On the other hand, its revenue missed significantly and its full-year EPS guidance fell slightly short of Wall Street’s estimates. Overall, this quarter could have been better. The stock traded down 11.3% to $6.86 immediately following the results.
Is Amneal an attractive investment opportunity at the current price? The latest quarter does matter, but not nearly as much as longer-term fundamentals and valuation, when deciding if the stock is a buy. We cover that in our actionable full research report which you can read here, it’s free.


