
Over the past six months, Ollie's has been a great trade. While the S&P 500 was flat, the stock price has climbed by 27.9% to $116.05 per share. This performance may have investors wondering how to approach the situation.
Is now still a good time to buy OLLI? Or are investors being too optimistic? Find out in our full research report, it’s free.
Why Does Ollie's Spark Debate?
Often located in suburban or semi-rural shopping centers, Ollie’s Bargain Outlet (NASDAQ: OLLI) is a discount retailer that acquires excess inventory then sells at meaningful discounts.
Two Things to Like:
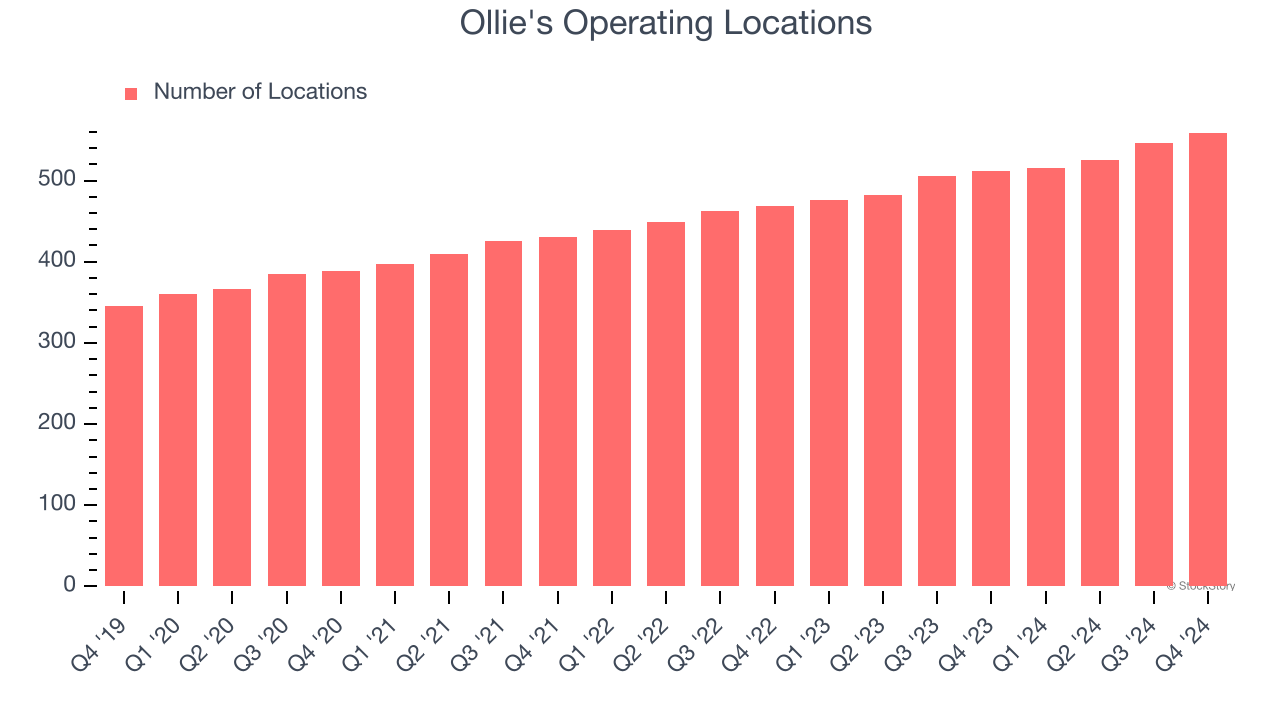
1. New Stores Opening at Breakneck Speed
The number of stores a retailer operates is a critical driver of how quickly company-level sales can grow.
Ollie's sported 559 locations in the latest quarter. Over the last two years, it has opened new stores at a rapid clip by averaging 8.6% annual growth, among the fastest in the consumer retail sector. This gives it a chance to scale into a mid-sized business over time.
When a retailer opens new stores, it usually means it’s investing for growth because demand is greater than supply, especially in areas where consumers may not have a store within reasonable driving distance.
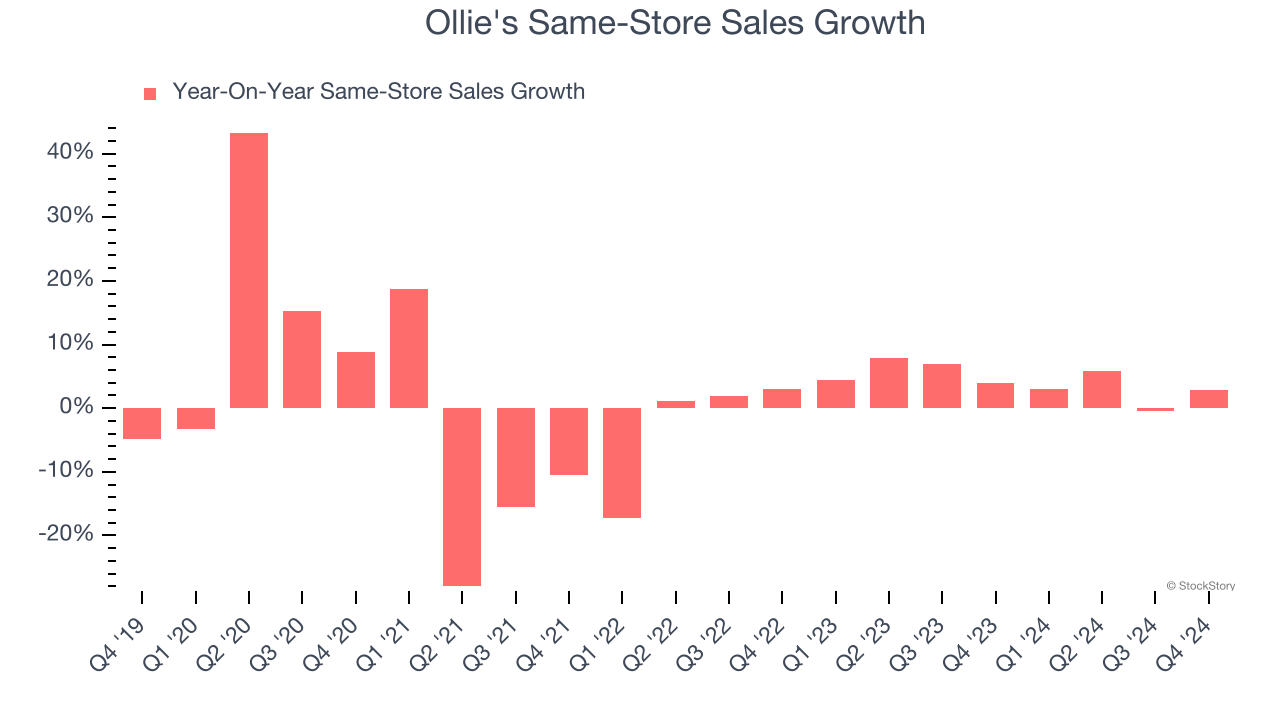
2. Surging Same-Store Sales Show Increasing Demand
Same-store sales show the change in sales for a retailer's e-commerce platform and brick-and-mortar shops that have existed for at least a year. This is a key performance indicator because it measures organic growth.
Ollie’s demand has been spectacular for a retailer over the last two years. On average, the company has increased its same-store sales by an impressive 4.3% per year.
One Reason to be Careful:
Fewer Distribution Channels Limit its Ceiling
With $2.27 billion in revenue over the past 12 months, Ollie's is a small retailer, which sometimes brings disadvantages compared to larger competitors benefiting from economies of scale and negotiating leverage with suppliers. On the bright side, it can grow faster because it has more white space to build new stores.
Final Judgment
Ollie’s merits more than compensate for its flaws, and with its shares outperforming the market lately, the stock trades at 30.8× forward P/E (or $116.05 per share). Is now a good time to initiate a position? See for yourself in our full research report, it’s free.
Stocks We Like Even More Than Ollie's
Donald Trump’s victory in the 2024 U.S. Presidential Election sent major indices to all-time highs, but stocks have retraced as investors debate the health of the economy and the potential impact of tariffs.
While this leaves much uncertainty around 2025, a few companies are poised for long-term gains regardless of the political or macroeconomic climate, like our Top 9 Market-Beating Stocks. This is a curated list of our High Quality stocks that have generated a market-beating return of 176% over the last five years.
Stocks that made our list in 2020 include now familiar names such as Nvidia (+1,545% between March 2020 and March 2025) as well as under-the-radar businesses like the once-micro-cap company Kadant (+351% five-year return). Find your next big winner with StockStory today.


