
Phreesia has had an impressive run over the past six months. While the S&P 500 has been flat, the stock has returned 34.2% and now trades at $25.49. This was partly thanks to its solid quarterly results, and the performance may have investors wondering how to approach the situation.
Is now the time to buy Phreesia, or should you be careful about including it in your portfolio? Get the full breakdown from our expert analysts, it’s free.
Why Is Phreesia Not Exciting?
Despite the momentum, we're swiping left on Phreesia for now. Here are three reasons why we avoid PHR and a stock we'd rather own.
1. Fewer Distribution Channels Limit its Ceiling
Larger companies benefit from economies of scale, where fixed costs like infrastructure, technology, and administration are spread over a higher volume of goods or services, reducing the cost per unit. Scale can also lead to bargaining power with suppliers, greater brand recognition, and more investment firepower. A virtuous cycle can ensue if a scaled company plays its cards right.
With just $419.8 million in revenue over the past 12 months, Phreesia is a small company in an industry where scale matters. This makes it difficult to build trust with customers because healthcare is heavily regulated, complex, and resource-intensive.
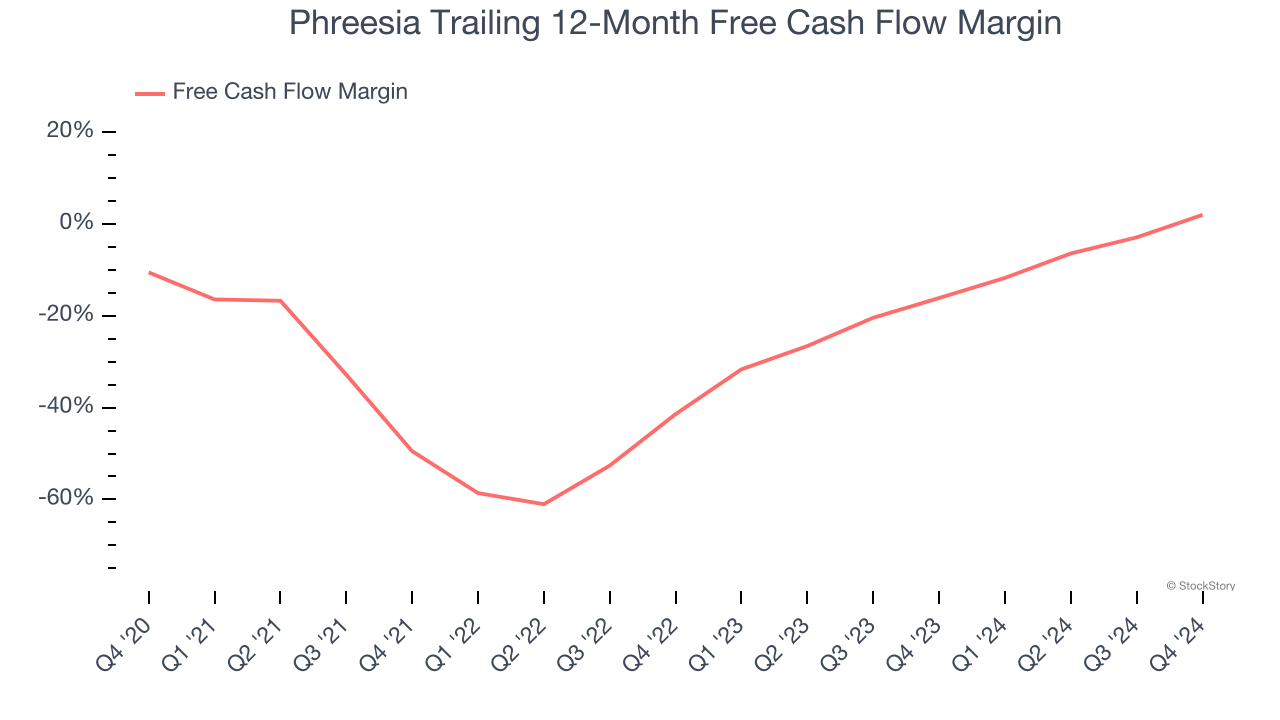
2. Cash Burn Ignites Concerns
If you’ve followed StockStory for a while, you know we emphasize free cash flow. Why, you ask? We believe that in the end, cash is king, and you can’t use accounting profits to pay the bills.
While Phreesia posted positive free cash flow this quarter, the broader story hasn’t been so clean. Phreesia’s demanding reinvestments have drained its resources over the last five years, putting it in a pinch and limiting its ability to return capital to investors. Its free cash flow margin averaged negative 20.2%, meaning it lit $20.21 of cash on fire for every $100 in revenue.
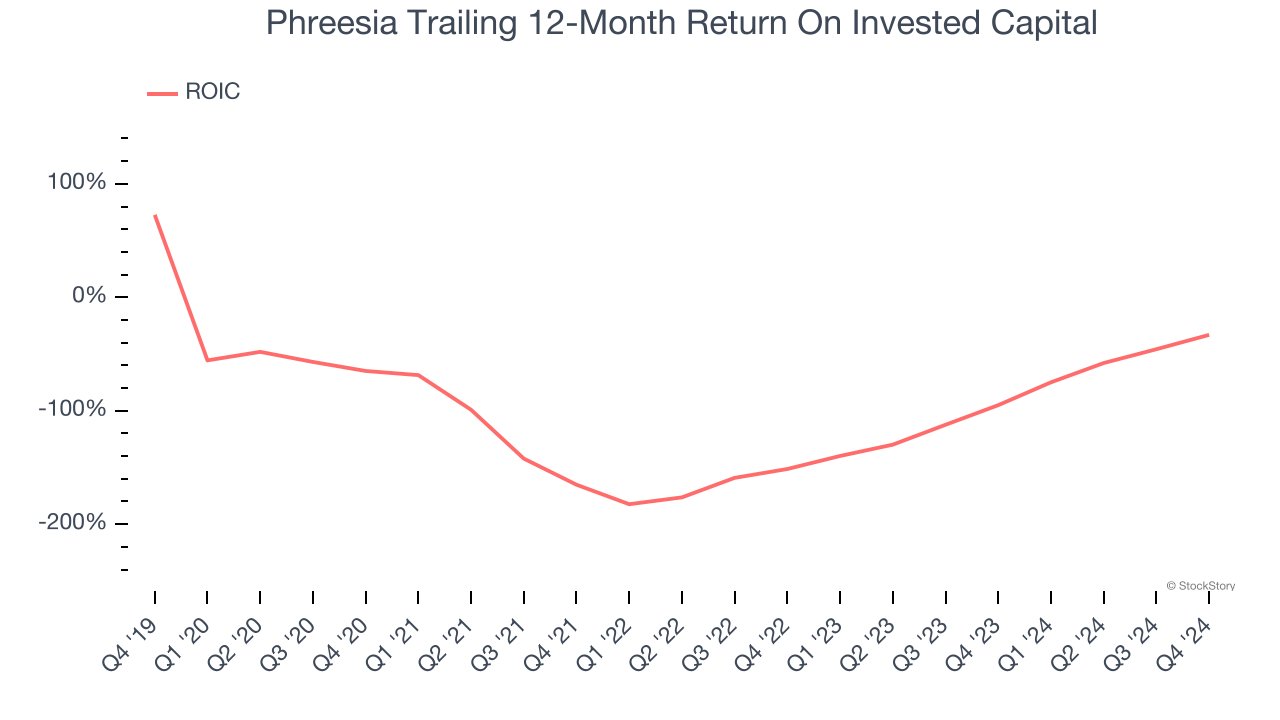
3. Previous Growth Initiatives Have Lost Money
Growth gives us insight into a company’s long-term potential, but how capital-efficient was that growth? A company’s ROIC explains this by showing how much operating profit it makes compared to the money it has raised (debt and equity).
Phreesia’s five-year average ROIC was negative 64.4%, meaning management lost money while trying to expand the business. Its returns were among the worst in the healthcare sector.
Final Judgment
Phreesia’s business quality ultimately falls short of our standards. With its shares beating the market recently, the stock trades at 30.1× forward P/E (or $25.49 per share). At this valuation, there’s a lot of good news priced in - we think there are better opportunities elsewhere. We’d suggest looking at a dominant Aerospace business that has perfected its M&A strategy.
Stocks We Like More Than Phreesia
The market surged in 2024 and reached record highs after Donald Trump’s presidential victory in November, but questions about new economic policies are adding much uncertainty for 2025.
While the crowd speculates what might happen next, we’re homing in on the companies that can succeed regardless of the political or macroeconomic environment. Put yourself in the driver’s seat and build a durable portfolio by checking out our Top 6 Stocks for this week. This is a curated list of our High Quality stocks that have generated a market-beating return of 176% over the last five years.
Stocks that made our list in 2020 include now familiar names such as Nvidia (+1,545% between March 2020 and March 2025) as well as under-the-radar businesses like the once-small-cap company Exlservice (+354% five-year return). Find your next big winner with StockStory today.