
Let’s dig into the relative performance of Middleby (NASDAQ: MIDD) and its peers as we unravel the now-completed Q1 professional tools and equipment earnings season.
Automation that increases efficiency and connected equipment that collects analyzable data have been trending, creating new demand. Some professional tools and equipment companies also provide software to accompany measurement or automated machinery, adding a stream of recurring revenues to their businesses. On the other hand, professional tools and equipment companies are at the whim of economic cycles. Consumer spending and interest rates, for example, can greatly impact the industrial production that drives demand for these companies’ offerings.
The 9 professional tools and equipment stocks we track reported a slower Q1. As a group, revenues missed analysts’ consensus estimates by 0.8%.
Thankfully, share prices of the companies have been resilient as they are up 6.8% on average since the latest earnings results.
Middleby (NASDAQ: MIDD)
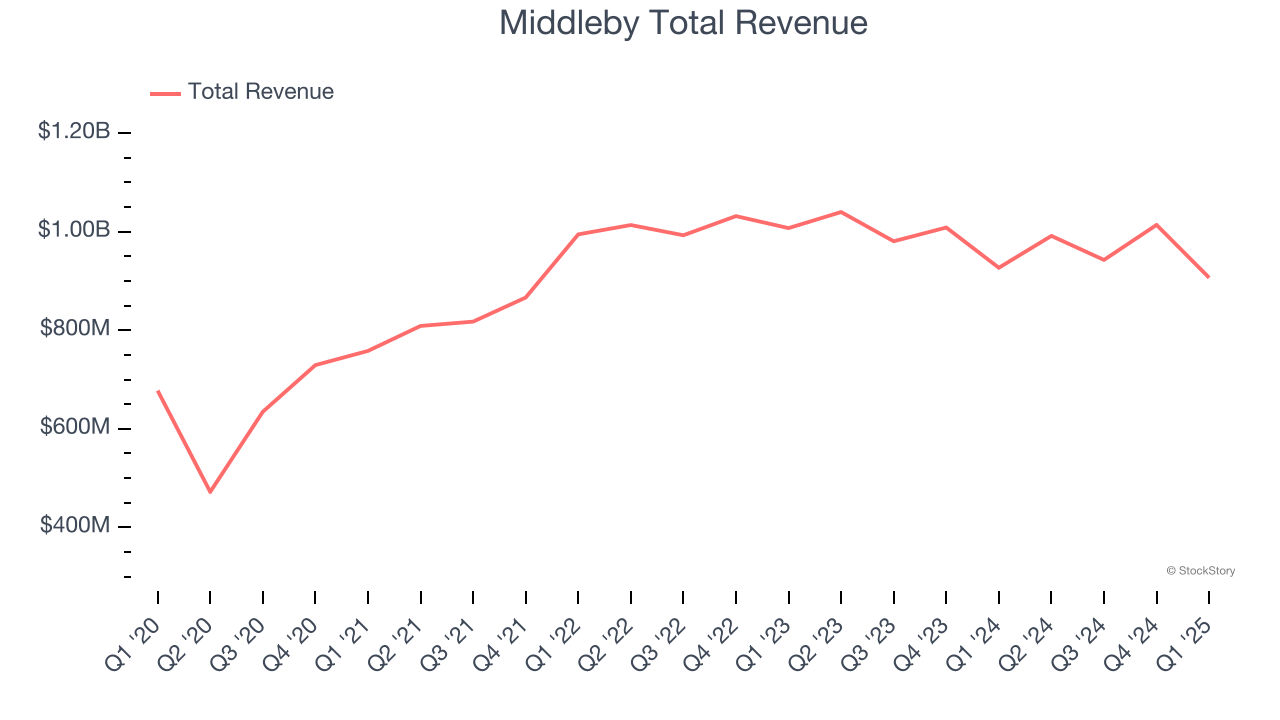
Holding a Guinness World Record for creating the world’s fastest conveyor pizza oven, Middleby (NYSE: MIDD) is a food service and equipment manufacturer.
Middleby reported revenues of $906.6 million, down 2.2% year on year. This print fell short of analysts’ expectations by 3.7%. Overall, it was a softer quarter for the company with a significant miss of analysts’ organic revenue and EBITDA estimates.
“Middleby has a demonstrated track record of operational excellence, strong cash flow generation and disciplined capital investments, which provides the foundation for our attractive capital allocation framework," said Tim FitzGerald, CEO of The Middleby Corporation.
Interestingly, the stock is up 9.8% since reporting and currently trades at $148.70.
Read our full report on Middleby here, it’s free.
Best Q1: ESAB (NYSE: ESAB)
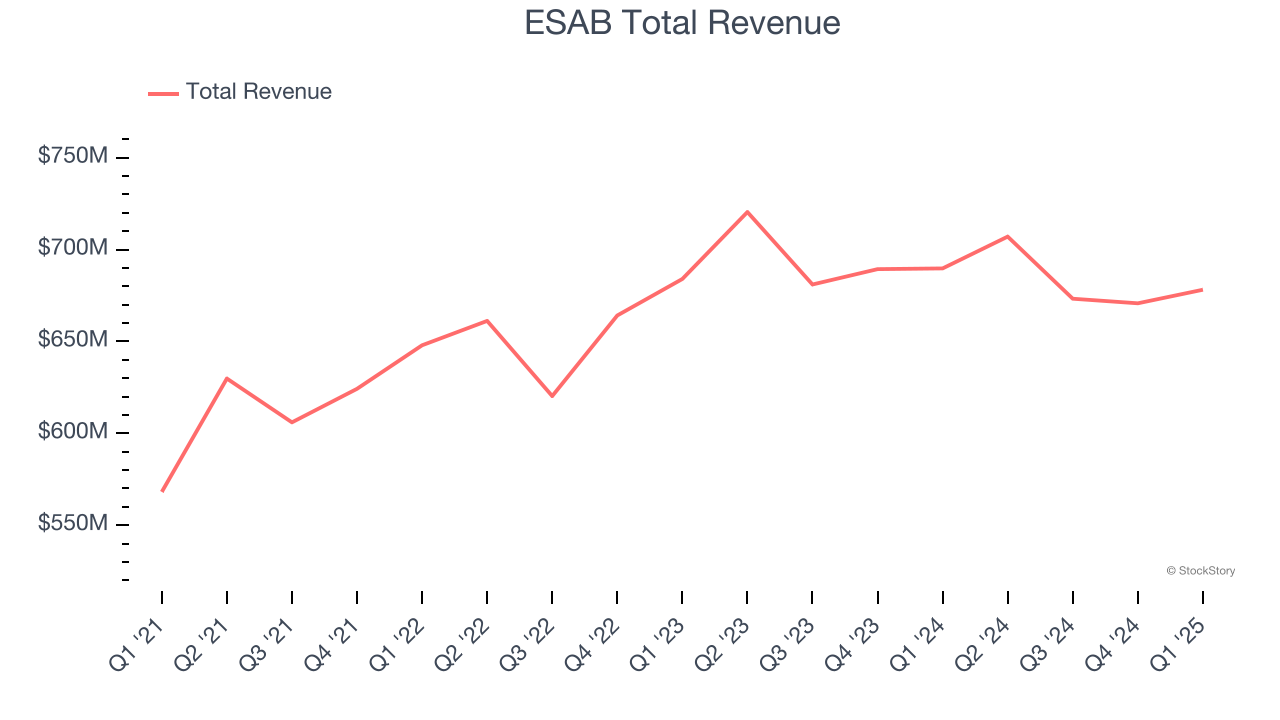
Having played a significant role in the construction of the iconic Sydney Opera House, ESAB (NYSE: ESAB) manufactures and sells welding and cutting equipment for numerous industries.
ESAB reported revenues of $678.1 million, down 1.7% year on year, outperforming analysts’ expectations by 2.2%. The business had a very strong quarter with an impressive beat of analysts’ EBITDA estimates.
The market seems happy with the results as the stock is up 7.3% since reporting. It currently trades at $128.90.
Is now the time to buy ESAB? Access our full analysis of the earnings results here, it’s free.
Weakest Q1: Snap-on (NYSE: SNA)
Founded in 1920, Snap-on (NYSE: SNA) is a global provider of tools, equipment, and diagnostics for various industries such as vehicle repair, aerospace, and the military.
Snap-on reported revenues of $1.24 billion, down 3% year on year, falling short of analysts’ expectations by 4.1%. It was a disappointing quarter as it posted a significant miss of analysts’ adjusted operating income estimates.
Snap-on delivered the weakest performance against analyst estimates in the group. As expected, the stock is down 1.6% since the results and currently trades at $326.73.
Read our full analysis of Snap-on’s results here.
Stanley Black & Decker (NYSE: SWK)
With an iconic “STANLEY” logo which has remained virtually unchanged for over a century, Stanley Black & Decker (NYSE: SWK) is a manufacturer primarily catering to the tool and outdoor equipment industry.
Stanley Black & Decker reported revenues of $3.74 billion, down 3.2% year on year. This print beat analysts’ expectations by 1.7%. Aside from that, it was a satisfactory quarter as it also recorded an impressive beat of analysts’ EPS estimates but a miss of analysts’ adjusted operating income estimates.
The stock is up 15.8% since reporting and currently trades at $70.85.
Read our full, actionable report on Stanley Black & Decker here, it’s free.
Lincoln Electric (NASDAQ: LECO)
Headquartered in Ohio, Lincoln Electric (NASDAQ: LECO) manufactures and sells welding equipment for various industries.
Lincoln Electric reported revenues of $1.00 billion, up 2.4% year on year. This number topped analysts’ expectations by 2.9%. Zooming out, it was a mixed quarter as it also logged a narrow beat of analysts’ organic revenue estimates but a miss of analysts’ EPS estimates.
Lincoln Electric achieved the biggest analyst estimates beat among its peers. The stock is up 8.2% since reporting and currently trades at $199.02.
Read our full, actionable report on Lincoln Electric here, it’s free.
Market Update
As a result of the Fed’s rate hikes in 2022 and 2023, inflation has come down from frothy levels post-pandemic. The general rise in the price of goods and services is trending towards the Fed’s 2% goal as of late, which is good news. The higher rates that fought inflation also didn't slow economic activity enough to catalyze a recession. So far, soft landing. This, combined with recent rate cuts (half a percent in September 2024 and a quarter percent in November 2024) have led to strong stock market performance in 2024. The icing on the cake for 2024 returns was Donald Trump’s victory in the U.S. Presidential Election in early November, sending major indices to all-time highs in the week following the election. Still, debates around the health of the economy and the impact of potential tariffs and corporate tax cuts remain, leaving much uncertainty around 2025.
Want to invest in winners with rock-solid fundamentals? Check out our Top 6 Stocks and add them to your watchlist. These companies are poised for growth regardless of the political or macroeconomic climate.
Join Paid Stock Investor Research
Help us make StockStory more helpful to investors like yourself. Join our paid user research session and receive a $50 Amazon gift card for your opinions. Sign up here.


