
Clothing and accessories retailer Urban Outfitters (NASDAQ: URBN) announced better-than-expected revenue in Q1 CY2025, with sales up 10.7% year on year to $1.33 billion. Its GAAP profit of $1.16 per share was 39.6% above analysts’ consensus estimates.
Is now the time to buy Urban Outfitters? Find out by accessing our full research report, it’s free.
Urban Outfitters (URBN) Q1 CY2025 Highlights:
- Revenue: $1.33 billion vs analyst estimates of $1.29 billion (10.7% year-on-year growth, 3% beat)
- EPS (GAAP): $1.16 vs analyst estimates of $0.83 (39.6% beat)
- Adjusted EBITDA: $165.5 million vs analyst estimates of $133.4 million (12.5% margin, 24.1% beat)
- Operating Margin: 9.6%, up from 6.2% in the same quarter last year
- Free Cash Flow was -$13.13 million, down from $17.46 million in the same quarter last year
- Same-Store Sales rose 4.8% year on year, in line with the same quarter last year
- Market Capitalization: $5.68 billion
“We are excited to announce record first quarter revenues and profits,” said Richard A. Hayne, Chief Executive Officer.
Company Overview
Founded as a purveyor of vintage items, Urban Outfitters (NASDAQ: URBN) now largely sells new apparel and accessories to teens and young adults seeking on-trend fashion.
Sales Growth
A company’s long-term performance is an indicator of its overall quality. Any business can put up a good quarter or two, but many enduring ones grow for years.
With $5.68 billion in revenue over the past 12 months, Urban Outfitters is a mid-sized retailer, which sometimes brings disadvantages compared to larger competitors benefiting from better economies of scale.
As you can see below, Urban Outfitters’s 6.2% annualized revenue growth over the last six years (we compare to 2019 to normalize for COVID-19 impacts) was tepid, but to its credit, it opened new stores and increased sales at existing, established locations.
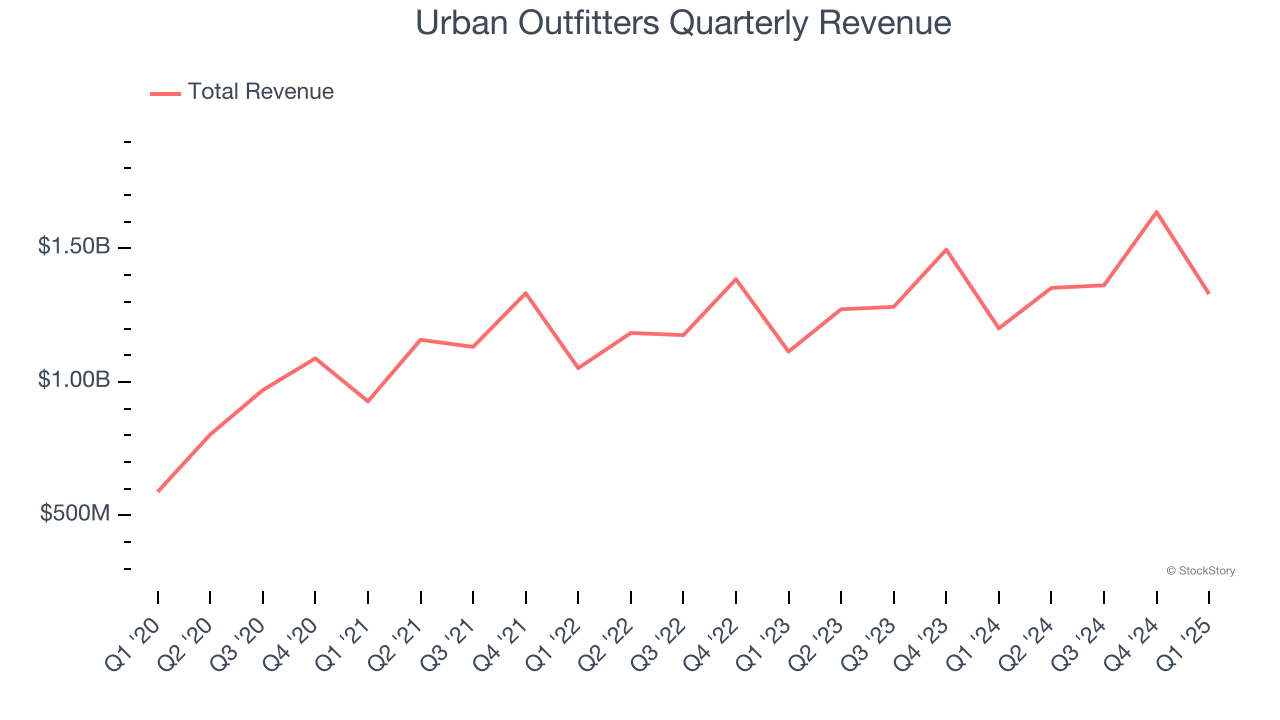
This quarter, Urban Outfitters reported year-on-year revenue growth of 10.7%, and its $1.33 billion of revenue exceeded Wall Street’s estimates by 3%.
Looking ahead, sell-side analysts expect revenue to grow 5.8% over the next 12 months, similar to its six-year rate. This projection is healthy and implies the market is baking in success for its products.
Today’s young investors won’t have read the timeless lessons in Gorilla Game: Picking Winners In High Technology because it was written more than 20 years ago when Microsoft and Apple were first establishing their supremacy. But if we apply the same principles, then enterprise software stocks leveraging their own generative AI capabilities may well be the Gorillas of the future. So, in that spirit, we are excited to present our Special Free Report on a profitable, fast-growing enterprise software stock that is already riding the automation wave and looking to catch the generative AI next.
Store Performance
Number of Stores
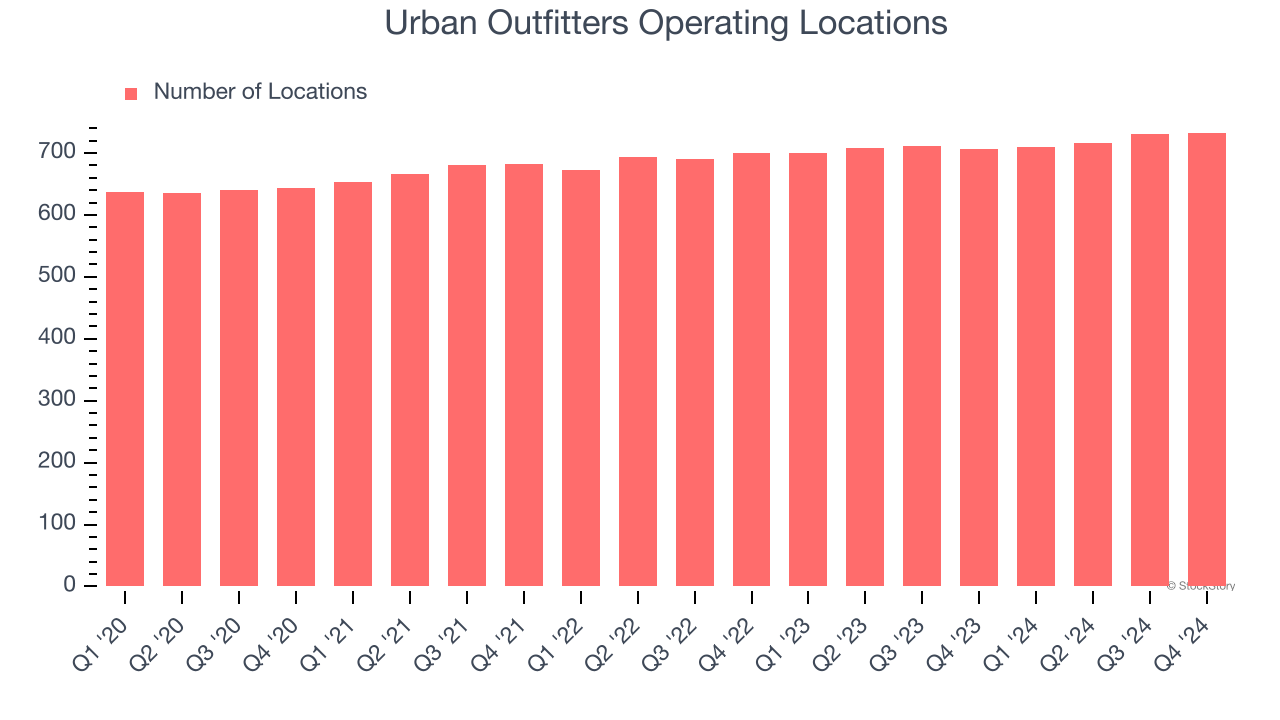
The number of stores a retailer operates is a critical driver of how quickly company-level sales can grow.
Urban Outfitters opened new stores quickly over the last two years, averaging 2.2% annual growth, faster than the broader consumer retail sector.
When a retailer opens new stores, it usually means it’s investing for growth because demand is greater than supply, especially in areas where consumers may not have a store within reasonable driving distance.
Note that Urban Outfitters reports its store count intermittently, so some data points are missing in the chart below.
Same-Store Sales
The change in a company's store base only tells one side of the story. The other is the performance of its existing locations and e-commerce sales, which informs management teams whether they should expand or downsize their physical footprints. Same-store sales is an industry measure of whether revenue is growing at those existing stores and is driven by customer visits (often called traffic) and the average spending per customer (ticket).
Urban Outfitters’s demand has been spectacular for a retailer over the last two years. On average, the company has increased its same-store sales by an impressive 4.2% per year. This performance suggests its rollout of new stores is beneficial for shareholders. We like this backdrop because it gives Urban Outfitters multiple ways to win: revenue growth can come from new stores, e-commerce, or increased foot traffic and higher sales per customer at existing locations.
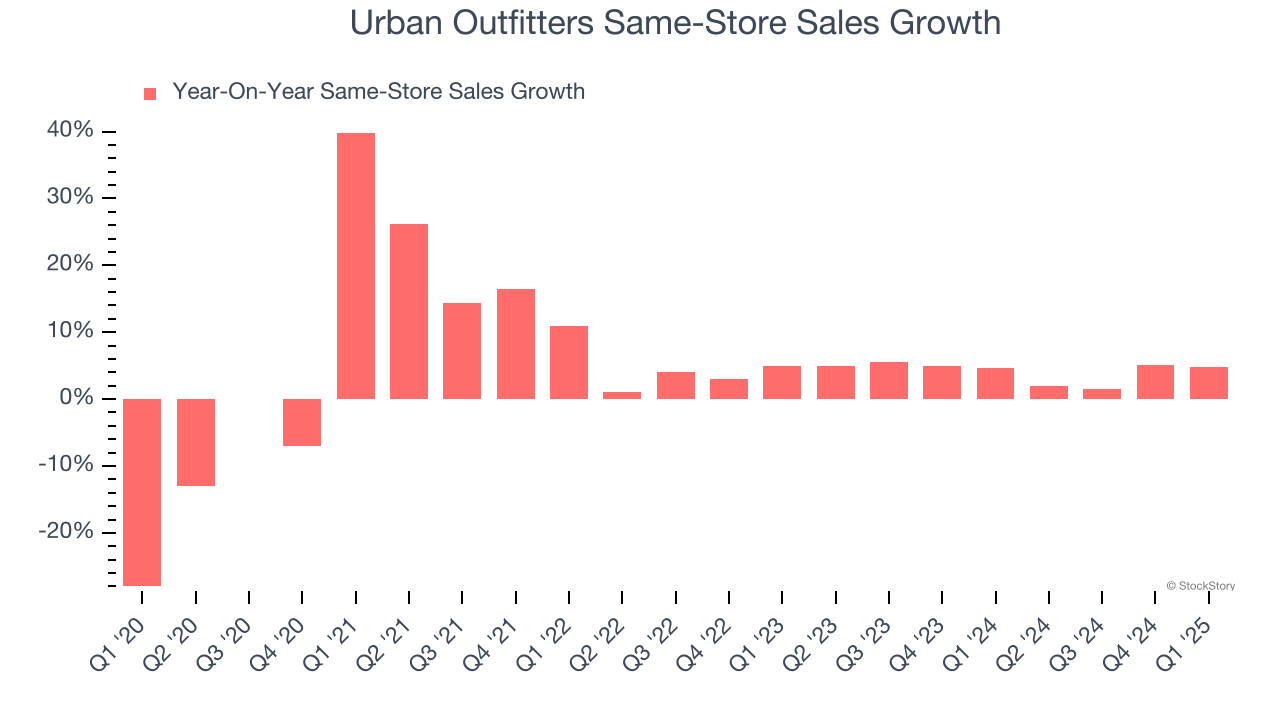
In the latest quarter, Urban Outfitters’s same-store sales rose 4.8% year on year. This performance was more or less in line with its historical levels.
Key Takeaways from Urban Outfitters’s Q1 Results
We were impressed by how significantly Urban Outfitters blew past analysts’ EPS expectations this quarter. We were also excited its EBITDA outperformed Wall Street’s estimates by a wide margin.Zooming out, we think this quarter featured some important positives. The stock traded up 6.1% to $63.25 immediately following the results.
Urban Outfitters may have had a good quarter, but does that mean you should invest right now? When making that decision, it’s important to consider its valuation, business qualities, as well as what has happened in the latest quarter. We cover that in our actionable full research report which you can read here, it’s free.
