As the Q1 earnings season comes to a close, it’s time to take stock of this quarter’s best and worst performers in the leisure products industry, including Clarus (NASDAQ: CLAR) and its peers.
Leisure products cover a wide range of goods in the consumer discretionary sector. Maintaining a strong brand is key to success, and those who differentiate themselves will enjoy customer loyalty and pricing power while those who don’t may find themselves in precarious positions due to the non-essential nature of their offerings.
The 10 leisure products stocks we track reported a mixed Q1. As a group, revenues beat analysts’ consensus estimates by 1.4% while next quarter’s revenue guidance was 5.2% below.
In light of this news, share prices of the companies have held steady as they are up 4.1% on average since the latest earnings results.
Clarus (NASDAQ: CLAR)
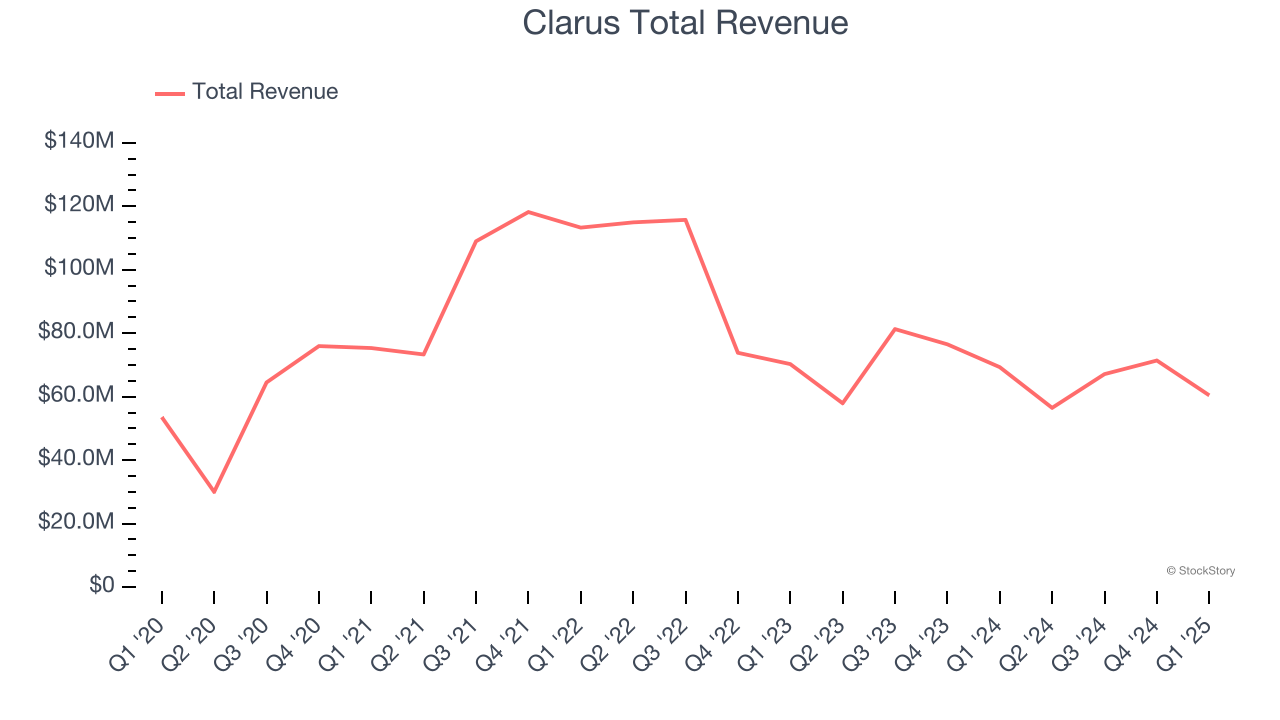
Initially a financial services business, Clarus (NASDAQ: CLAR) designs, manufactures, and distributes outdoor equipment and lifestyle products.
Clarus reported revenues of $60.43 million, down 12.8% year on year. This print exceeded analysts’ expectations by 7.5%. Despite the top-line beat, it was still a softer quarter for the company with a significant miss of analysts’ adjusted operating income estimates.
Management Commentary“Against an increasingly challenging consumer backdrop across the outdoor market, we continued to execute in line with our strategic roadmap in the first quarter, strengthening the core of our Outdoor segment and investing to scale our Adventure segment,” said Warren Kanders, Clarus’ Executive Chairman.
Unsurprisingly, the stock is down 8% since reporting and currently trades at $3.22.
Read our full report on Clarus here, it’s free.
Best Q1: Harley-Davidson (NYSE: HOG)
Founded in 1903, Harley-Davidson (NYSE: HOG) is an American motorcycle manufacturer known for its heavyweight motorcycles designed for cruising on highways.
Harley-Davidson reported revenues of $1.33 billion, down 23.1% year on year, falling short of analysts’ expectations by 1.2%. However, the business still had a very strong quarter with a solid beat of analysts’ EPS estimates and an impressive beat of analysts’ adjusted operating income estimates.
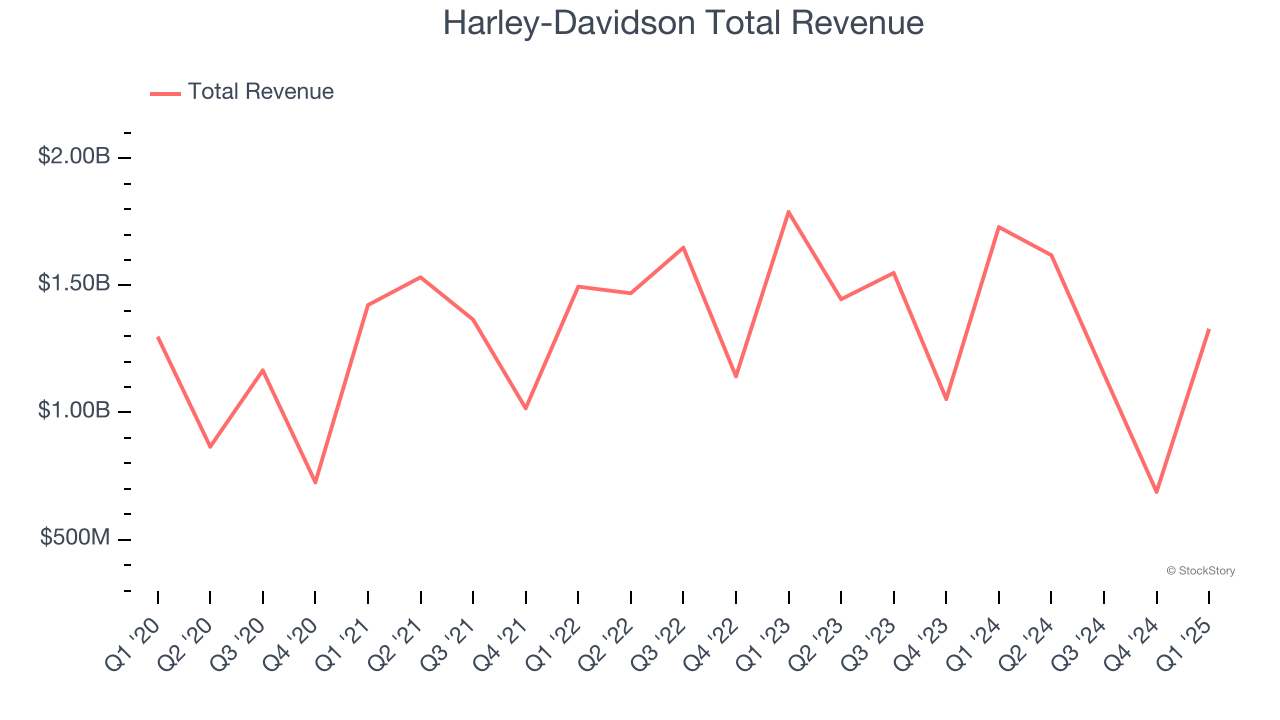
The market seems happy with the results as the stock is up 10.6% since reporting. It currently trades at $24.77.
Is now the time to buy Harley-Davidson? Access our full analysis of the earnings results here, it’s free.
Weakest Q1: Ruger (NYSE: RGR)
Founded in 1949, Ruger (NYSE: RGR) is an American manufacturer of firearms for the commercial sporting market.
Ruger reported revenues of $135.7 million, flat year on year, falling short of analysts’ expectations by 8.3%. It was a disappointing quarter as it posted a miss of analysts’ EPS and EBITDA estimates.
Ruger delivered the weakest performance against analyst estimates in the group. As expected, the stock is down 11.5% since the results and currently trades at $35.96.
Read our full analysis of Ruger’s results here.
Acushnet (NYSE: GOLF)
Producer of the acclaimed Titleist Pro V1 golf ball, Acushnet (NYSE: GOLF) is a design and manufacturing company specializing in performance-driven golf products.
Acushnet reported revenues of $703.4 million, flat year on year. This print beat analysts’ expectations by 0.7%. Zooming out, it was a mixed quarter as it also recorded a decent beat of analysts’ EPS estimates but a miss of analysts’ Titleist Clubs revenue estimates.
The stock is up 6.5% since reporting and currently trades at $69.19.
Read our full, actionable report on Acushnet here, it’s free.
YETI (NYSE: YETI)
Founded by two brothers from Texas, YETI (NYSE: YETI) specializes in durable outdoor goods including coolers, drinkware, and other gear tailored to adventure enthusiasts.
YETI reported revenues of $351.1 million, up 2.9% year on year. This number topped analysts’ expectations by 1.2%. Aside from that, it was a mixed quarter as it also produced a solid beat of analysts’ adjusted operating income estimates but full-year EPS guidance missing analysts’ expectations.
The stock is up 6.3% since reporting and currently trades at $29.73.
Read our full, actionable report on YETI here, it’s free.
Market Update
Thanks to the Fed’s rate hikes in 2022 and 2023, inflation has been on a steady path downward, easing back toward that 2% sweet spot. Fortunately (miraculously to some), all this tightening didn’t send the economy tumbling into a recession, so here we are, cautiously celebrating a soft landing. The cherry on top? Recent rate cuts (half a point in September 2024, a quarter in November) have propped up markets, especially after Trump’s November win lit a fire under major indices and sent them to all-time highs. However, there’s still plenty to ponder — tariffs, corporate tax cuts, and what 2025 might hold for the economy.
Want to invest in winners with rock-solid fundamentals? Check out our Top 6 Stocks and add them to your watchlist. These companies are poised for growth regardless of the political or macroeconomic climate.
Join Paid Stock Investor Research
Help us make StockStory more helpful to investors like yourself. Join our paid user research session and receive a $50 Amazon gift card for your opinions. Sign up here.