
Kitchenware and home goods retailer Williams-Sonoma (NYSE: WSM) reported revenue ahead of Wall Street’s expectations in Q1 CY2025, with sales up 4.2% year on year to $1.73 billion. Its GAAP profit of $1.85 per share was 5.4% above analysts’ consensus estimates.
Is now the time to buy Williams-Sonoma? Find out by accessing our full research report, it’s free.
Williams-Sonoma (WSM) Q1 CY2025 Highlights:
- Revenue: $1.73 billion vs analyst estimates of $1.66 billion (4.2% year-on-year growth, 4% beat)
- EPS (GAAP): $1.85 vs analyst estimates of $1.76 (5.4% beat)
- Reiterating full-year 2025 guidance, which includes "the additional tariffs on China of 30% and the global reciprocal tariff of 10%, along with the tariffs we spoke about in March, including the tariff on Mexico and Canada of 25% and the tariff on steel and aluminum of 25%"
- Operating Margin: 16.8%, down from 19.1% in the same quarter last year
- Free Cash Flow Margin: 3.5%, down from 11% in the same quarter last year
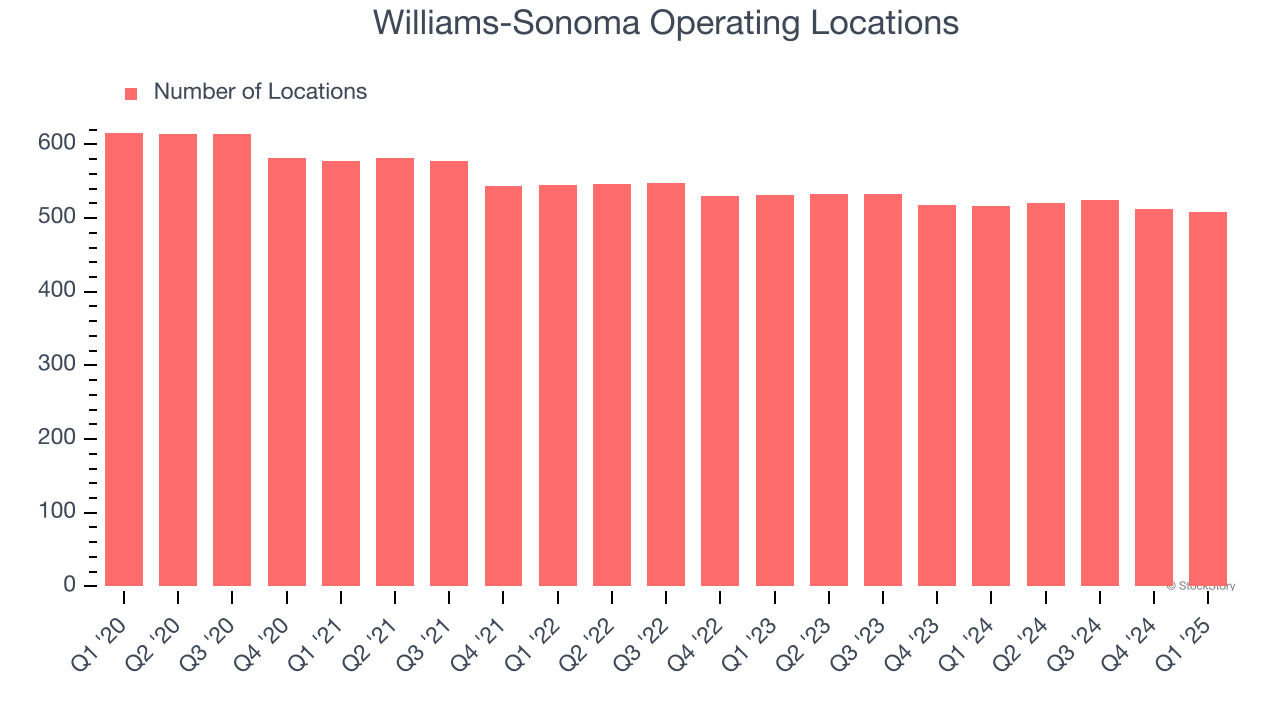
- Locations: 508 at quarter end, down from 517 in the same quarter last year
- Same-Store Sales rose 3.4% year on year (-4.9% in the same quarter last year)
- Market Capitalization: $20.64 billion
Company Overview
Started in 1956 as a store specializing in French cookware, Williams-Sonoma (NYSE: WSM) is a specialty retailer of higher-end kitchenware, home goods, and furniture.
Sales Growth
Reviewing a company’s long-term sales performance reveals insights into its quality. Any business can put up a good quarter or two, but many enduring ones grow for years.
With $7.78 billion in revenue over the past 12 months, Williams-Sonoma is a mid-sized retailer, which sometimes brings disadvantages compared to larger competitors benefiting from better economies of scale.
As you can see below, Williams-Sonoma grew its sales at a tepid 5.3% compounded annual growth rate over the last six years (we compare to 2019 to normalize for COVID-19 impacts) as it closed stores.
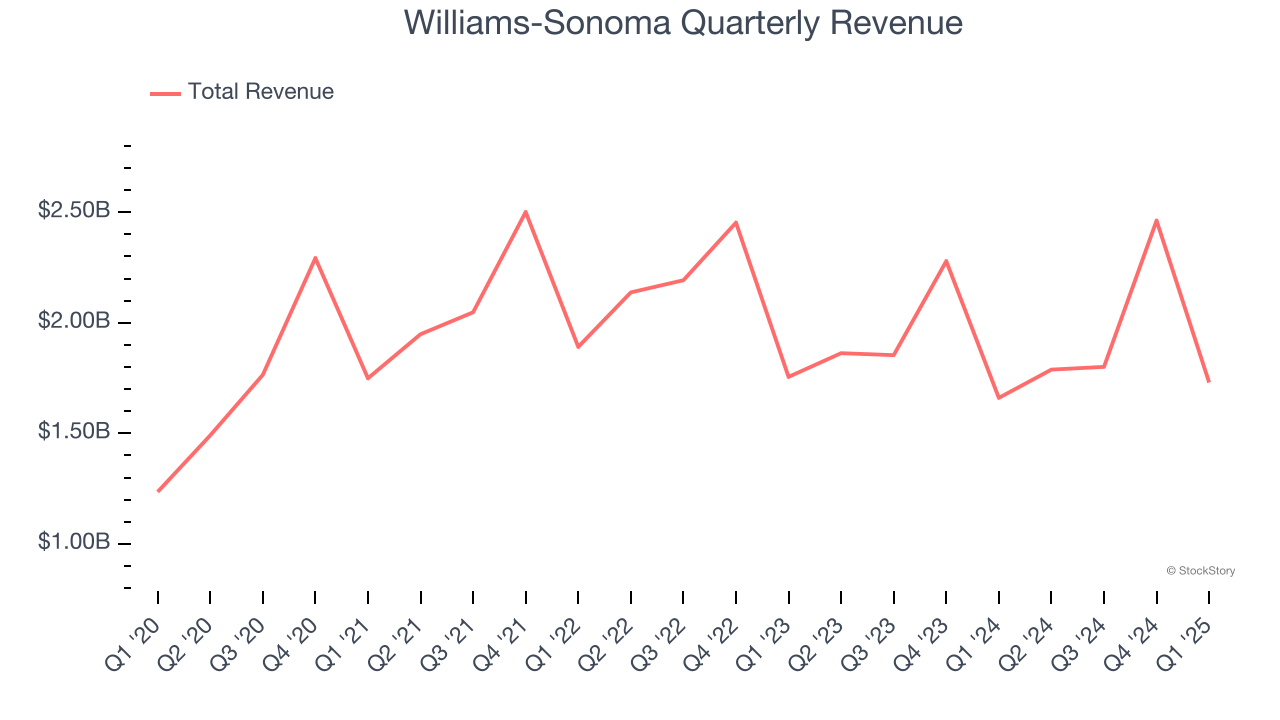
This quarter, Williams-Sonoma reported modest year-on-year revenue growth of 4.2% but beat Wall Street’s estimates by 4%.
Looking ahead, sell-side analysts expect revenue to decline by 1% over the next 12 months, a deceleration versus the last six years. This projection is underwhelming and suggests its products will face some demand challenges.
Today’s young investors won’t have read the timeless lessons in Gorilla Game: Picking Winners In High Technology because it was written more than 20 years ago when Microsoft and Apple were first establishing their supremacy. But if we apply the same principles, then enterprise software stocks leveraging their own generative AI capabilities may well be the Gorillas of the future. So, in that spirit, we are excited to present our Special Free Report on a profitable, fast-growing enterprise software stock that is already riding the automation wave and looking to catch the generative AI next.
Store Performance
Number of Stores
The number of stores a retailer operates is a critical driver of how quickly company-level sales can grow.
Williams-Sonoma operated 508 locations in the latest quarter. Over the last two years, the company has generally closed its stores, averaging 2.1% annual declines.
When a retailer shutters stores, it usually means that brick-and-mortar demand is less than supply, and it is responding by closing underperforming locations to improve profitability.
Same-Store Sales
A company's store base only paints one part of the picture. When demand is high, it makes sense to open more. But when demand is low, it’s prudent to close some locations and use the money in other ways. Same-store sales is an industry measure of whether revenue is growing at those existing stores and is driven by customer visits (often called traffic) and the average spending per customer (ticket).
Williams-Sonoma’s demand has been shrinking over the last two years as its same-store sales have averaged 4.7% annual declines. This performance isn’t ideal, and Williams-Sonoma is attempting to boost same-store sales by closing stores (fewer locations sometimes lead to higher same-store sales).
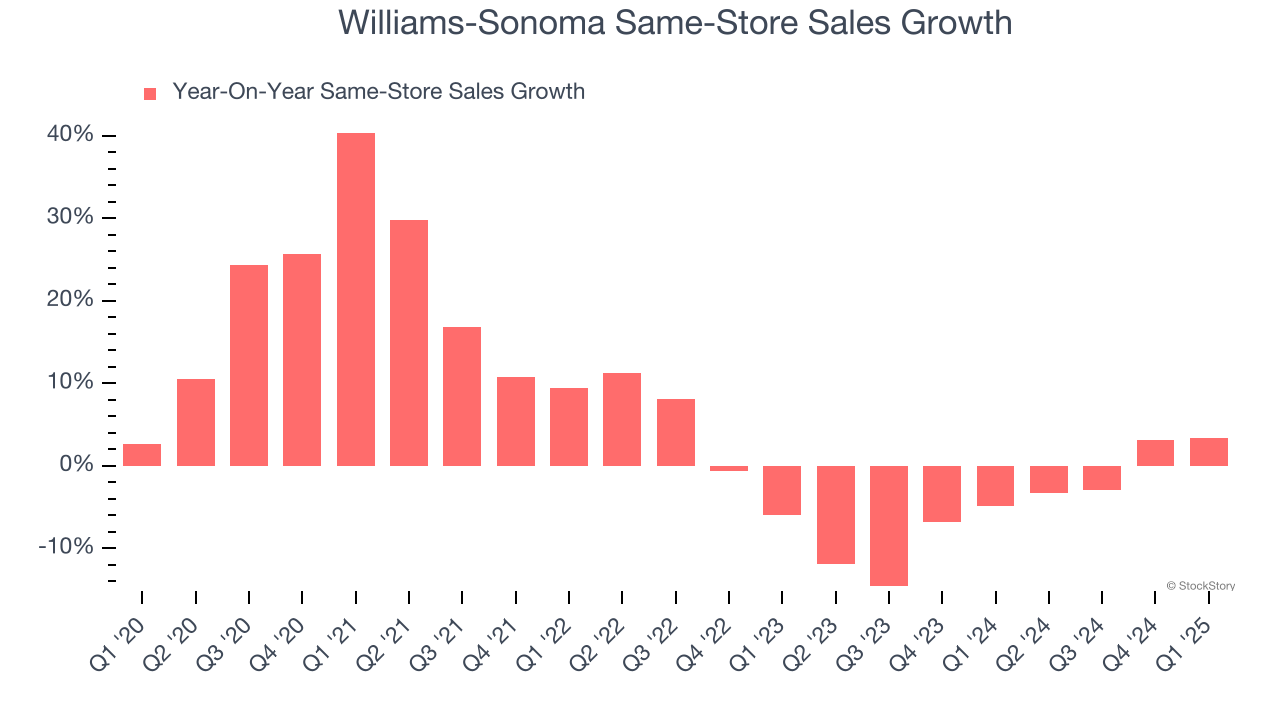
In the latest quarter, Williams-Sonoma’s same-store sales rose 3.4% year on year. This growth was a well-appreciated turnaround from its historical levels, showing the business is regaining momentum.
Key Takeaways from Williams-Sonoma’s Q1 Results
We liked how Williams-Sonoma beat analysts’ revenue and EPS expectations this quarter. On the other hand, its gross margin missed. Looking ahead, the company reiterated full-year guidance but warned of tariff headwinds and macro uncertainty. Investors were also likely hoping for more--perhaps a raise in guidance to flow through the Q1 beat--and shares traded down 5.8% to $158.01 immediately following the results.
So should you invest in Williams-Sonoma right now? If you’re making that decision, you should consider the bigger picture of valuation, business qualities, as well as the latest earnings. We cover that in our actionable full research report which you can read here, it’s free.