Inter Parfums has followed the market’s trajectory closely. The stock is down 5.4% to $130 per share over the past six months while the S&P 500 has lost 3.6%. This might have investors contemplating their next move.
Given the weaker price action, is now an opportune time to buy IPAR? Find out in our full research report, it’s free.
Why Is Inter Parfums a Good Business?
With licenses to produce colognes and perfumes under brands such as Kate Spade, Van Cleef & Arpels, and Abercrombie & Fitch, Inter Parfums (NASDAQ: IPAR) manufactures and distributes fragrances worldwide.
1. Skyrocketing Revenue Shows Strong Momentum
A company’s long-term sales performance is one signal of its overall quality. Any business can experience short-term success, but top-performing ones enjoy sustained growth for years. Thankfully, Inter Parfums’s 16.3% annualized revenue growth over the last three years was impressive. Its growth surpassed the average consumer staples company and shows its offerings resonate with customers. 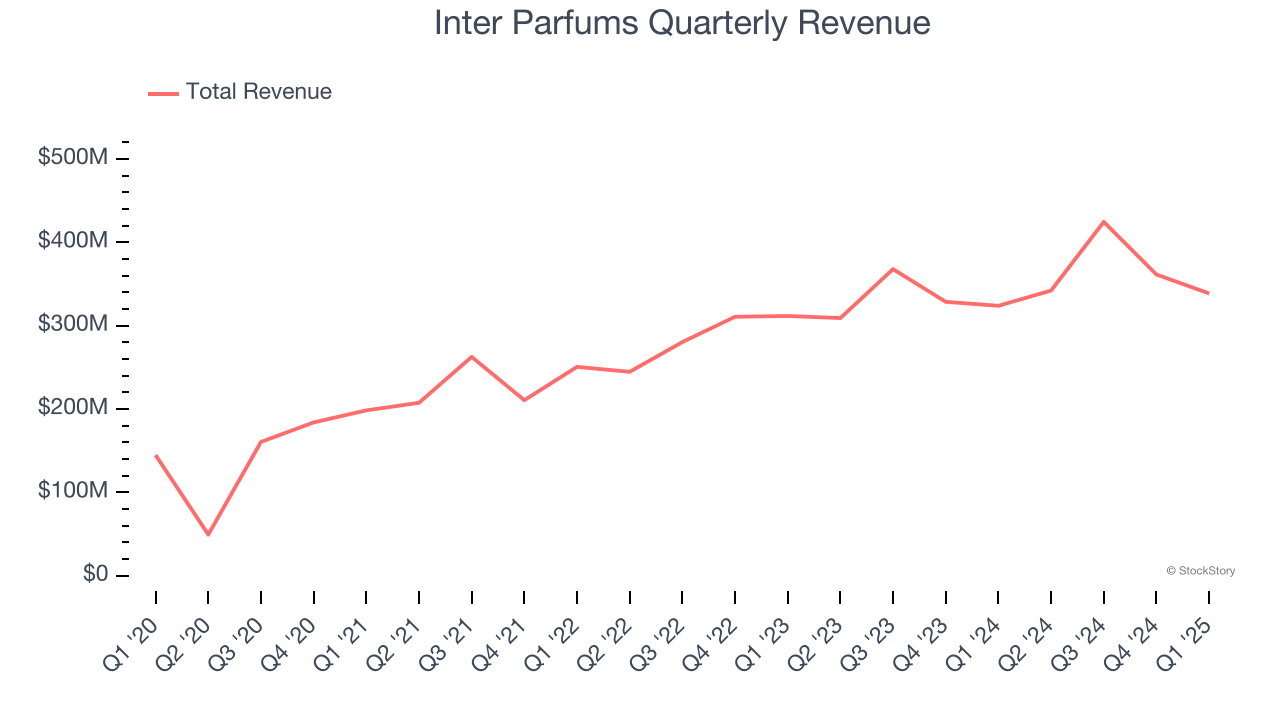
2. Elite Gross Margin Powers Best-In-Class Business Model
At StockStory, we prefer high gross margin businesses because they indicate pricing power or differentiated products, giving the company a chance to generate higher operating profits.
Inter Parfums has best-in-class unit economics for a consumer staples company, enabling it to invest in areas such as marketing and talent. As you can see below, it averaged an elite 55.6% gross margin over the last two years. That means for every $100 in revenue, only $44.45 went towards paying for raw materials, production of goods, transportation, and distribution. 
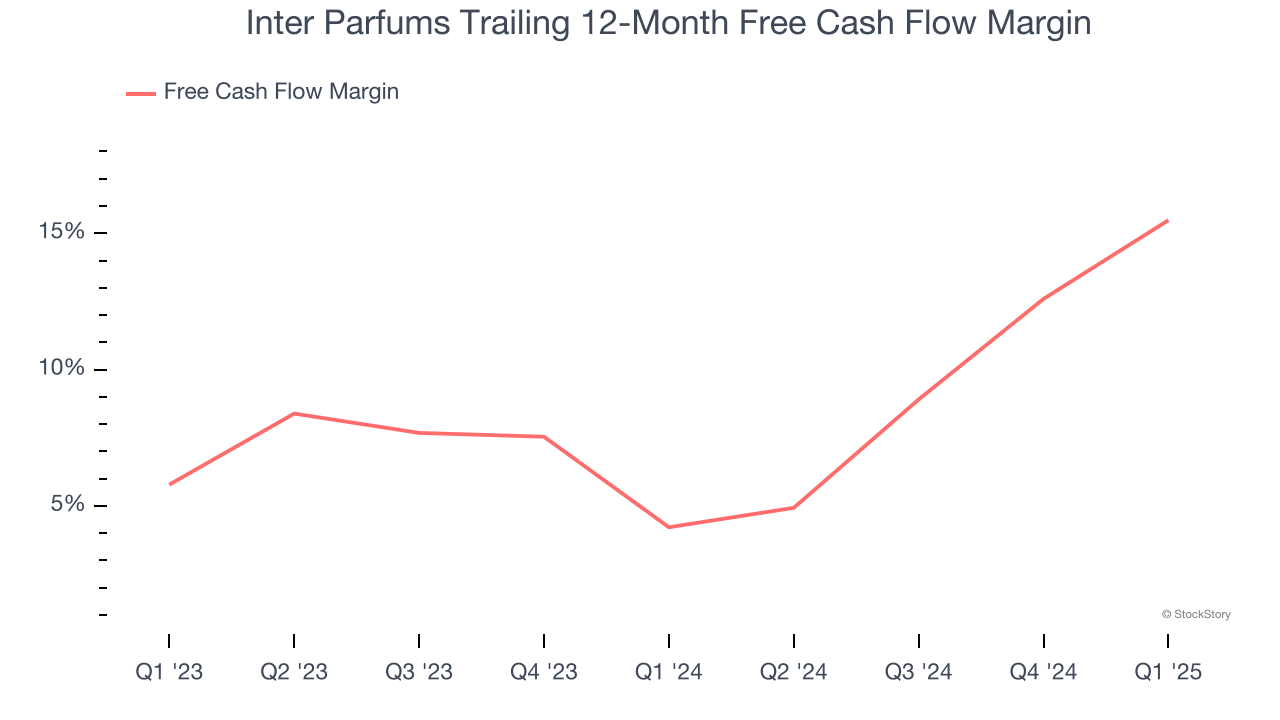
3. Increasing Free Cash Flow Margin Juices Financials
If you’ve followed StockStory for a while, you know we emphasize free cash flow. Why, you ask? We believe that in the end, cash is king, and you can’t use accounting profits to pay the bills.
As you can see below, Inter Parfums’s margin expanded by 11.3 percentage points over the last year. This is encouraging, and we can see it became a less capital-intensive business because its free cash flow profitability rose more than its operating profitability. Inter Parfums’s free cash flow margin for the trailing 12 months was 15.5%.
Final Judgment
These are just a few reasons why we're bullish on Inter Parfums. After the recent drawdown, the stock trades at 23.5× forward P/E (or $130 per share). Is now the time to initiate a position? See for yourself in our comprehensive research report, it’s free.
Stocks We Like Even More Than Inter Parfums
The market surged in 2024 and reached record highs after Donald Trump’s presidential victory in November, but questions about new economic policies are adding much uncertainty for 2025.
While the crowd speculates what might happen next, we’re homing in on the companies that can succeed regardless of the political or macroeconomic environment. Put yourself in the driver’s seat and build a durable portfolio by checking out our Top 9 Market-Beating Stocks. This is a curated list of our High Quality stocks that have generated a market-beating return of 176% over the last five years.
Stocks that made our list in 2020 include now familiar names such as Nvidia (+1,545% between March 2020 and March 2025) as well as under-the-radar businesses like the once-small-cap company Exlservice (+354% five-year return). Find your next big winner with StockStory today.