
Sphere Entertainment has followed the market’s trajectory closely. The stock is down 7.1% to $37.38 per share over the past six months while the S&P 500 has lost 3.3%. This might have investors contemplating their next move.
Is now the time to buy Sphere Entertainment, or should you be careful about including it in your portfolio? Get the full breakdown from our expert analysts, it’s free.
Why Do We Think Sphere Entertainment Will Underperform?
Despite the more favorable entry price, we're sitting this one out for now. Here are three reasons why SPHR doesn't excite us and a stock we'd rather own.
1. Long-Term Revenue Growth Disappoints
A company’s long-term performance is an indicator of its overall quality. Even a bad business can shine for one or two quarters, but a top-tier one grows for years. Unfortunately, Sphere Entertainment’s 2.4% annualized revenue growth over the last five years was weak. This fell short of our benchmarks. 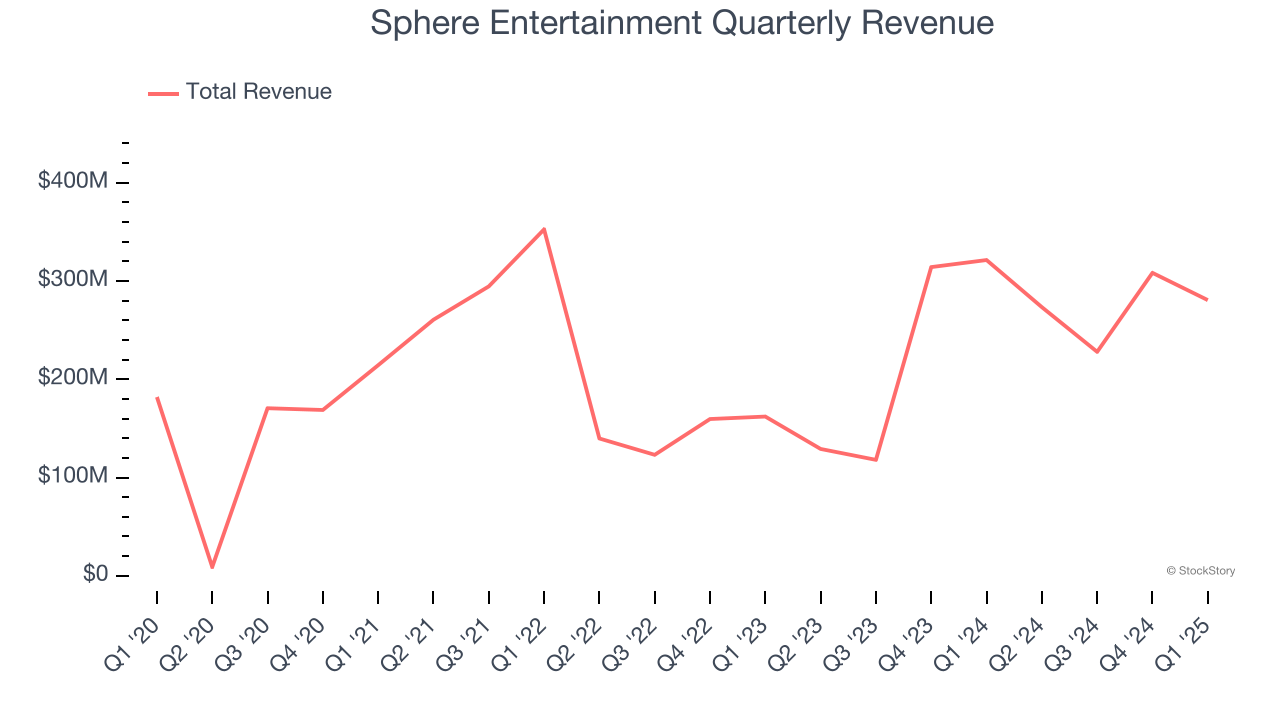
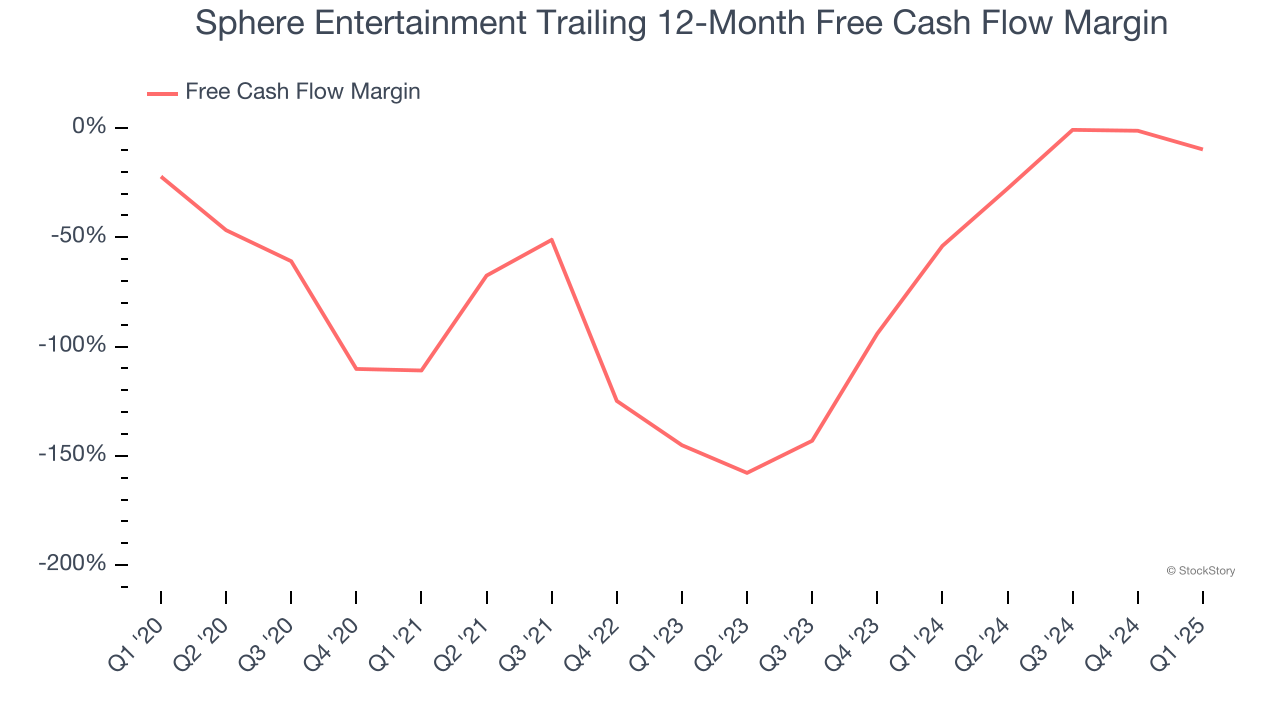
2. Cash Burn Ignites Concerns
If you’ve followed StockStory for a while, you know we emphasize free cash flow. Why, you ask? We believe that in the end, cash is king, and you can’t use accounting profits to pay the bills.
Over the last two years, Sphere Entertainment’s demanding reinvestments to stay relevant have drained its resources, putting it in a pinch and limiting its ability to return capital to investors. Its free cash flow margin averaged negative 29.5%, meaning it lit $29.52 of cash on fire for every $100 in revenue.
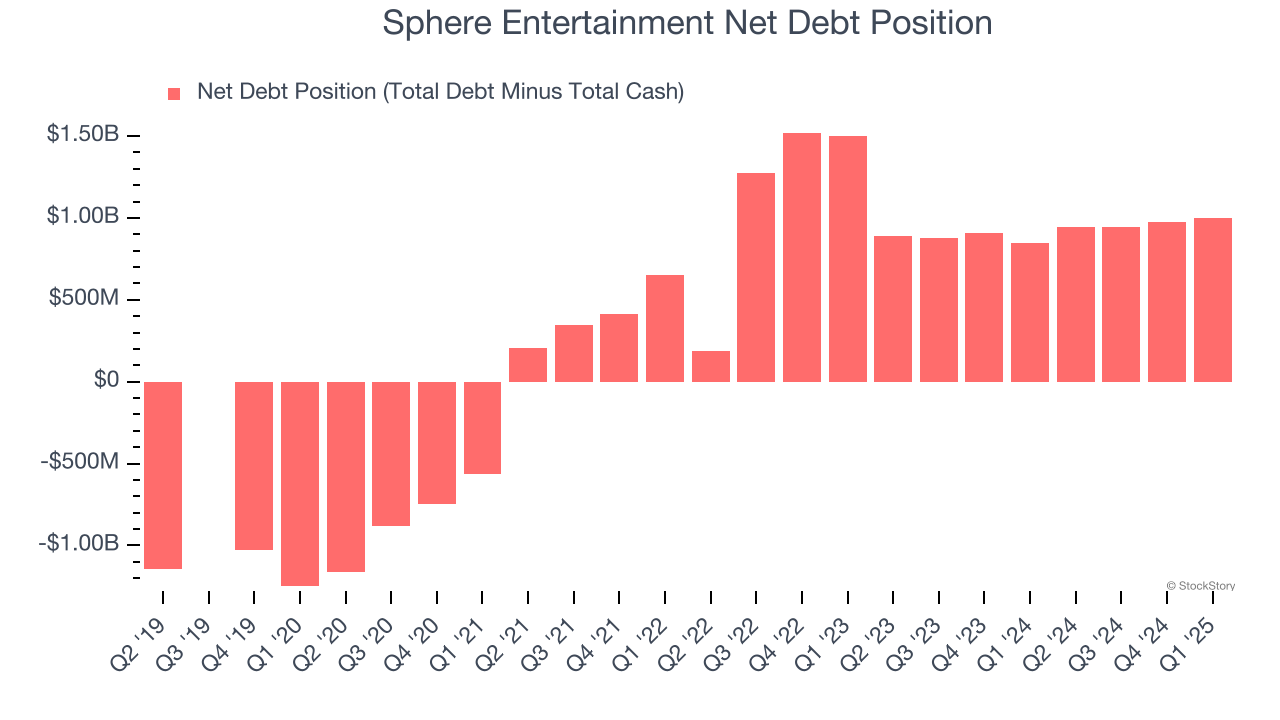
3. Short Cash Runway Exposes Shareholders to Potential Dilution
As long-term investors, the risk we care about most is the permanent loss of capital, which can happen when a company goes bankrupt or raises money from a disadvantaged position. This is separate from short-term stock price volatility, something we are much less bothered by.
Sphere Entertainment burned through $106.5 million of cash over the last year, and its $1.46 billion of debt exceeds the $465 million of cash on its balance sheet. This is a deal breaker for us because indebted loss-making companies spell trouble.
Unless the Sphere Entertainment’s fundamentals change quickly, it might find itself in a position where it must raise capital from investors to continue operating. Whether that would be favorable is unclear because dilution is a headwind for shareholder returns.
We remain cautious of Sphere Entertainment until it generates consistent free cash flow or any of its announced financing plans materialize on its balance sheet.
Final Judgment
We see the value of companies helping consumers, but in the case of Sphere Entertainment, we’re out. After the recent drawdown, the stock trades at 7.4× forward EV-to-EBITDA (or $37.38 per share). While this valuation is optically cheap, the potential downside is huge given its shaky fundamentals. There are better stocks to buy right now. Let us point you toward the most entrenched endpoint security platform on the market.
Stocks We Would Buy Instead of Sphere Entertainment
The market surged in 2024 and reached record highs after Donald Trump’s presidential victory in November, but questions about new economic policies are adding much uncertainty for 2025.
While the crowd speculates what might happen next, we’re homing in on the companies that can succeed regardless of the political or macroeconomic environment. Put yourself in the driver’s seat and build a durable portfolio by checking out our Top 9 Market-Beating Stocks. This is a curated list of our High Quality stocks that have generated a market-beating return of 183% over the last five years (as of March 31st 2025).
Stocks that made our list in 2020 include now familiar names such as Nvidia (+1,545% between March 2020 and March 2025) as well as under-the-radar businesses like the once-small-cap company Exlservice (+354% five-year return). Find your next big winner with StockStory today.


