Earnings results often indicate what direction a company will take in the months ahead. With Q1 behind us, let’s have a look at NVR (NYSE: NVR) and its peers.
Traditionally, homebuilders have built competitive advantages with economies of scale that lead to advantaged purchasing and brand recognition among consumers. Aesthetic trends have always been important in the space, but more recently, energy efficiency and conservation are driving innovation. However, these companies are still at the whim of the macro, specifically interest rates that heavily impact new and existing home sales. In fact, homebuilders are one of the most cyclical subsectors within industrials.
The 11 home builders stocks we track reported a slower Q1. As a group, revenues beat analysts’ consensus estimates by 1%.
Amidst this news, share prices of the companies have had a rough stretch. On average, they are down 5.7% since the latest earnings results.
NVR (NYSE: NVR)
Known for its unique land acquisition strategy, NVR (NYSE: NVR) is a respected homebuilder and mortgage company in the United States.
NVR reported revenues of $2.40 billion, up 3% year on year. This print exceeded analysts’ expectations by 0.8%. Despite the top-line beat, it was still a disappointing quarter for the company with a significant miss of analysts’ adjusted operating income estimates.
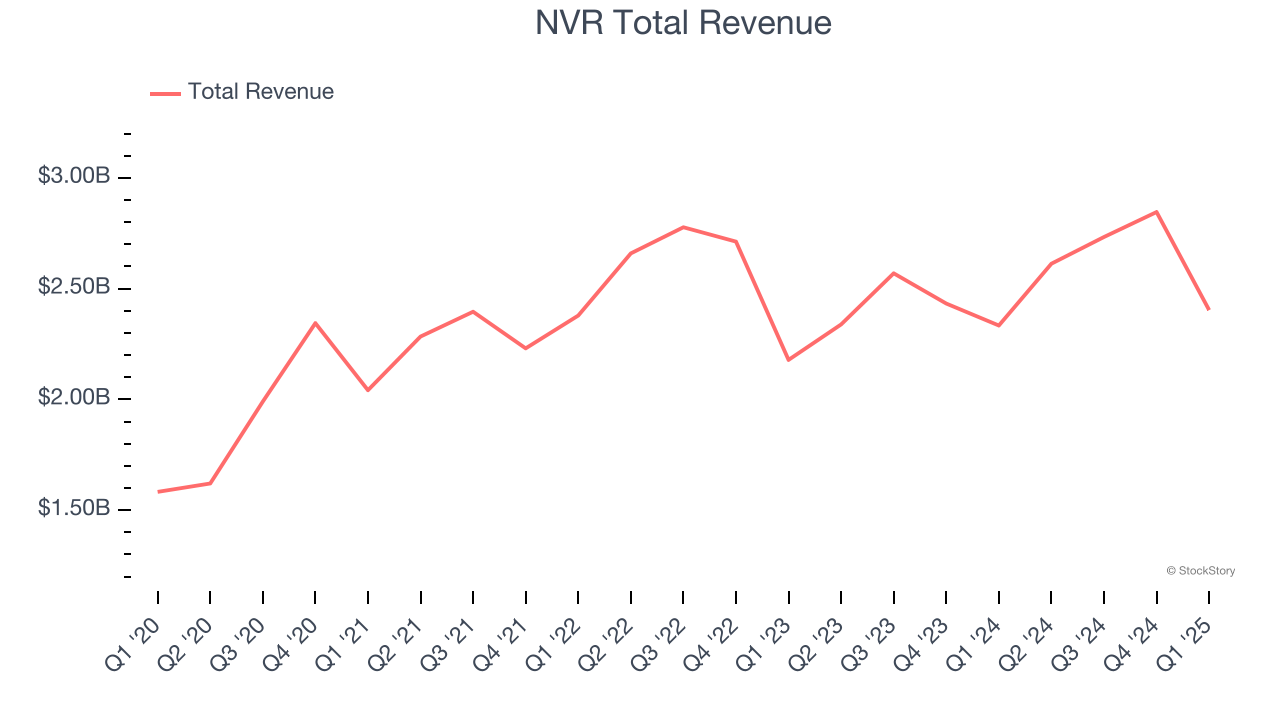
Unsurprisingly, the stock is down 1.1% since reporting and currently trades at $7,066.
Read our full report on NVR here, it’s free.
Best Q1: Toll Brothers (NYSE: TOL)
Started by two brothers who started by building and selling just one home in Pennsylvania, today Toll Brothers (NYSE: TOL) is a luxury homebuilder across the United States.
Toll Brothers reported revenues of $2.74 billion, down 3.5% year on year, outperforming analysts’ expectations by 9.9%. The business had an incredible quarter with an impressive beat of analysts’ EBITDA estimates and a solid beat of analysts’ EPS estimates.
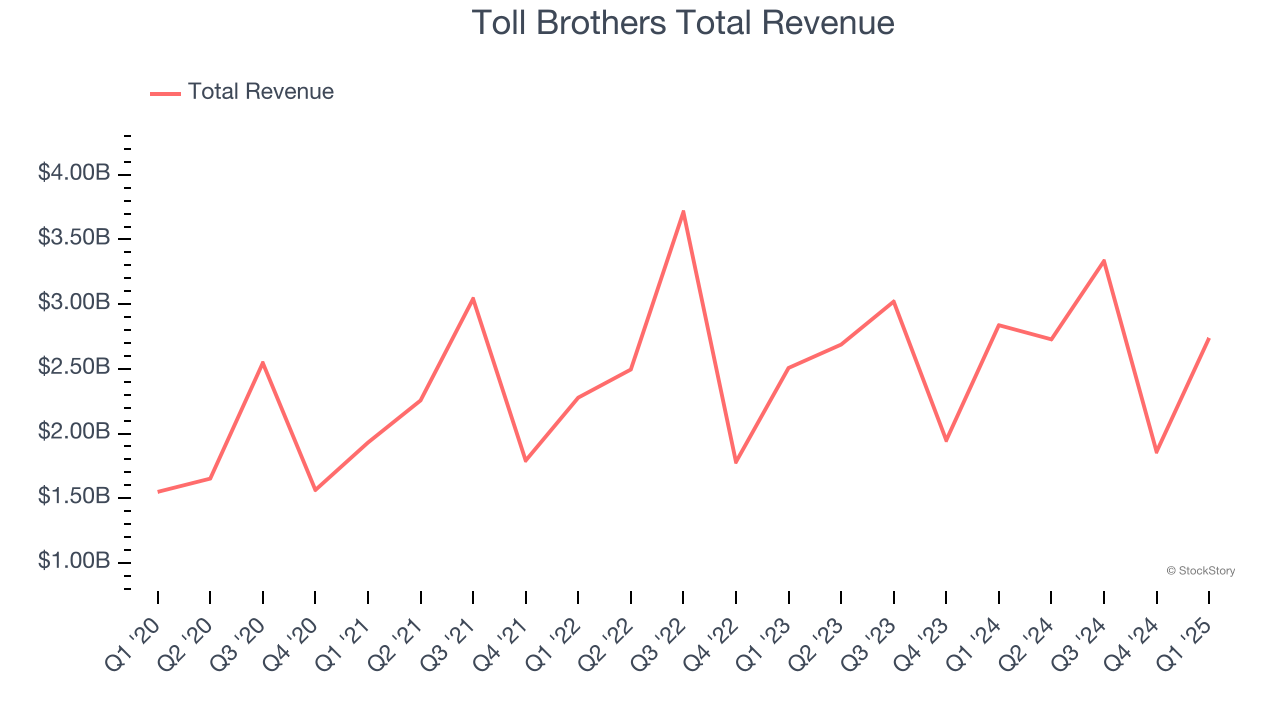
Toll Brothers achieved the biggest analyst estimates beat among its peers. However, the results were likely priced into the stock as it’s traded sideways since reporting. Shares currently sit at $104.06.
Is now the time to buy Toll Brothers? Access our full analysis of the earnings results here, it’s free.
Weakest Q1: LGI Homes (NASDAQ: LGIH)
Based in Texas, LGI Homes (NASDAQ: LGIH) is a homebuilding company specializing in constructing affordable, entry-level single-family homes in desirable communities across the United States.
LGI Homes reported revenues of $351.4 million, down 10.1% year on year, falling short of analysts’ expectations by 5%. It was a disappointing quarter as it posted a significant miss of analysts’ adjusted operating income estimates.
As expected, the stock is down 13% since the results and currently trades at $51.50.
Read our full analysis of LGI Homes’s results here.
Taylor Morrison Home (NYSE: TMHC)
Named “America’s Most Trusted Home Builder” in 2019, Taylor Morrison Home (NYSE: TMHC) builds single family homes and communities across the United States.
Taylor Morrison Home reported revenues of $1.90 billion, up 11.5% year on year. This result beat analysts’ expectations by 5.7%. It was a strong quarter as it also produced an impressive beat of analysts’ EBITDA estimates.
Taylor Morrison Home delivered the fastest revenue growth among its peers. The stock is down 1.8% since reporting and currently trades at $57.76.
Read our full, actionable report on Taylor Morrison Home here, it’s free.
Tri Pointe Homes (NYSE: TPH)
Established in 2009 in California, Tri Pointe Homes (NYSE: TPH) is a United States homebuilder recognized for its innovative and sustainable approach to creating premium, life-enhancing homes.
Tri Pointe Homes reported revenues of $740.9 million, down 21.1% year on year. This print surpassed analysts’ expectations by 4%. Overall, it was a strong quarter as it also logged an impressive beat of analysts’ EPS estimates and a solid beat of analysts’ EBITDA estimates.
Tri Pointe Homes had the slowest revenue growth among its peers. The stock is down 3.2% since reporting and currently trades at $29.85.
Read our full, actionable report on Tri Pointe Homes here, it’s free.
Market Update
As a result of the Fed’s rate hikes in 2022 and 2023, inflation has come down from frothy levels post-pandemic. The general rise in the price of goods and services is trending towards the Fed’s 2% goal as of late, which is good news. The higher rates that fought inflation also didn't slow economic activity enough to catalyze a recession. So far, soft landing. This, combined with recent rate cuts (half a percent in September 2024 and a quarter percent in November 2024) have led to strong stock market performance in 2024. The icing on the cake for 2024 returns was Donald Trump’s victory in the U.S. Presidential Election in early November, sending major indices to all-time highs in the week following the election. Still, debates around the health of the economy and the impact of potential tariffs and corporate tax cuts remain, leaving much uncertainty around 2025.
Want to invest in winners with rock-solid fundamentals? Check out our Strong Momentum Stocks and add them to your watchlist. These companies are poised for growth regardless of the political or macroeconomic climate.
Join Paid Stock Investor Research
Help us make StockStory more helpful to investors like yourself. Join our paid user research session and receive a $50 Amazon gift card for your opinions. Sign up here.