Sporting goods retailer Dick’s Sporting Goods (NYSE: DKS) announced better-than-expected revenue in Q1 CY2025, with sales up 5.2% year on year to $3.17 billion. On the other hand, the company’s full-year revenue guidance of $13.75 billion at the midpoint came in 0.8% below analysts’ estimates. Its GAAP profit of $3.24 per share was 0.7% above analysts’ consensus estimates.
Is now the time to buy Dick's? Find out by accessing our full research report, it’s free.
Dick's (DKS) Q1 CY2025 Highlights:
- Revenue: $3.17 billion vs analyst estimates of $3.15 billion (5.2% year-on-year growth, 0.7% beat)
- EPS (GAAP): $3.24 vs analyst estimates of $3.22 (0.7% beat)
- Adjusted EBITDA: $483.2 million vs analyst estimates of $442.8 million (15.2% margin, 9.1% beat)
- The company reconfirmed its revenue guidance for the full year of $13.75 billion at the midpoint
- EPS (GAAP) guidance for the full year is $14.10 at the midpoint, missing analyst estimates by 2.2%
- Operating Margin: 11.5%, in line with the same quarter last year
- Free Cash Flow was -$86.68 million, down from $74.19 million in the same quarter last year
- Locations: 885 at quarter end, up from 857 in the same quarter last year
- Same-Store Sales rose 4.5% year on year, in line with the same quarter last year
- Market Capitalization: $13.95 billion
Company Overview
Started as a hunting supply store, Dick’s Sporting Goods (NYSE: DKS) is a retailer that sells merchandise for traditional sports as well as for fitness and outdoor activities.
Sales Growth
Examining a company’s long-term performance can provide clues about its quality. Any business can put up a good quarter or two, but the best consistently grow over the long haul.
With $13.6 billion in revenue over the past 12 months, Dick's is a mid-sized retailer, which sometimes brings disadvantages compared to larger competitors benefiting from better economies of scale.
As you can see below, Dick's grew its sales at a mediocre 8.3% compounded annual growth rate over the last six years (we compare to 2019 to normalize for COVID-19 impacts) as its store footprint remained unchanged.
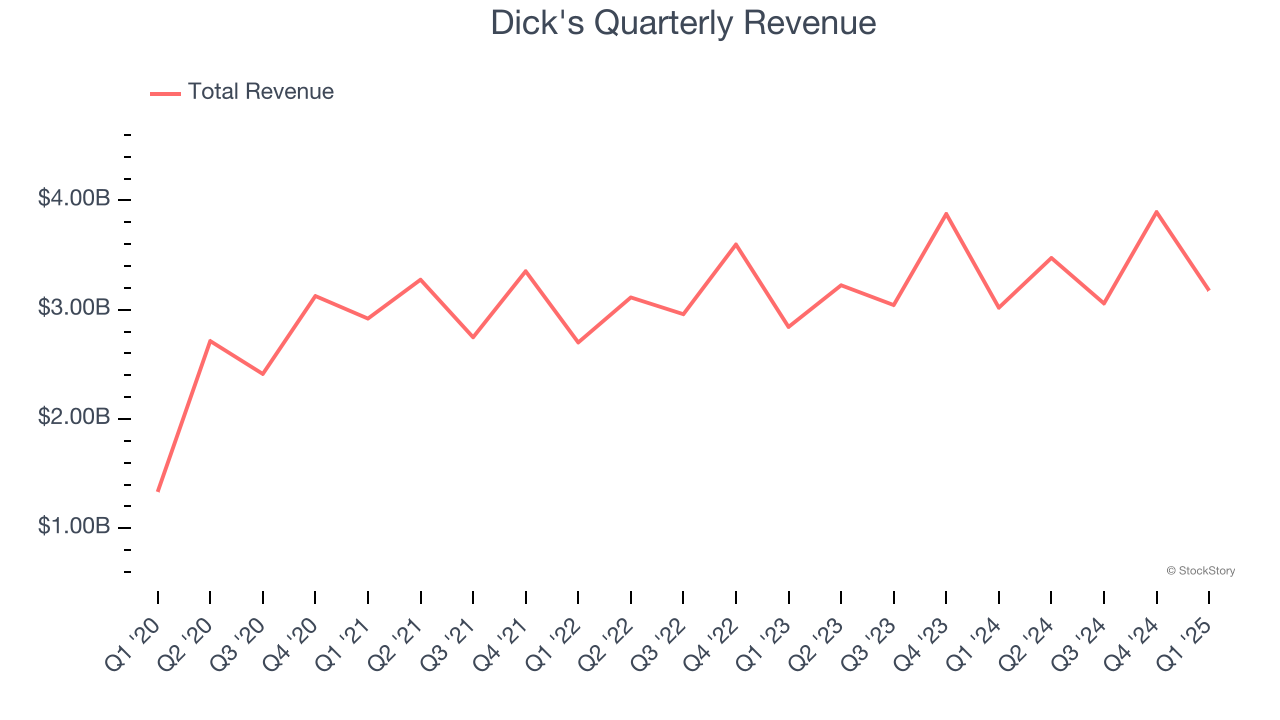
This quarter, Dick's reported year-on-year revenue growth of 5.2%, and its $3.17 billion of revenue exceeded Wall Street’s estimates by 0.7%.
Looking ahead, sell-side analysts expect revenue to grow 3% over the next 12 months, a deceleration versus the last six years. We still think its growth trajectory is satisfactory given its scale and indicates the market is forecasting success for its products.
Unless you’ve been living under a rock, it should be obvious by now that generative AI is going to have a huge impact on how large corporations do business. While Nvidia and AMD are trading close to all-time highs, we prefer a lesser-known (but still profitable) stock benefiting from the rise of AI. Click here to access our free report one of our favorites growth stories.
Store Performance
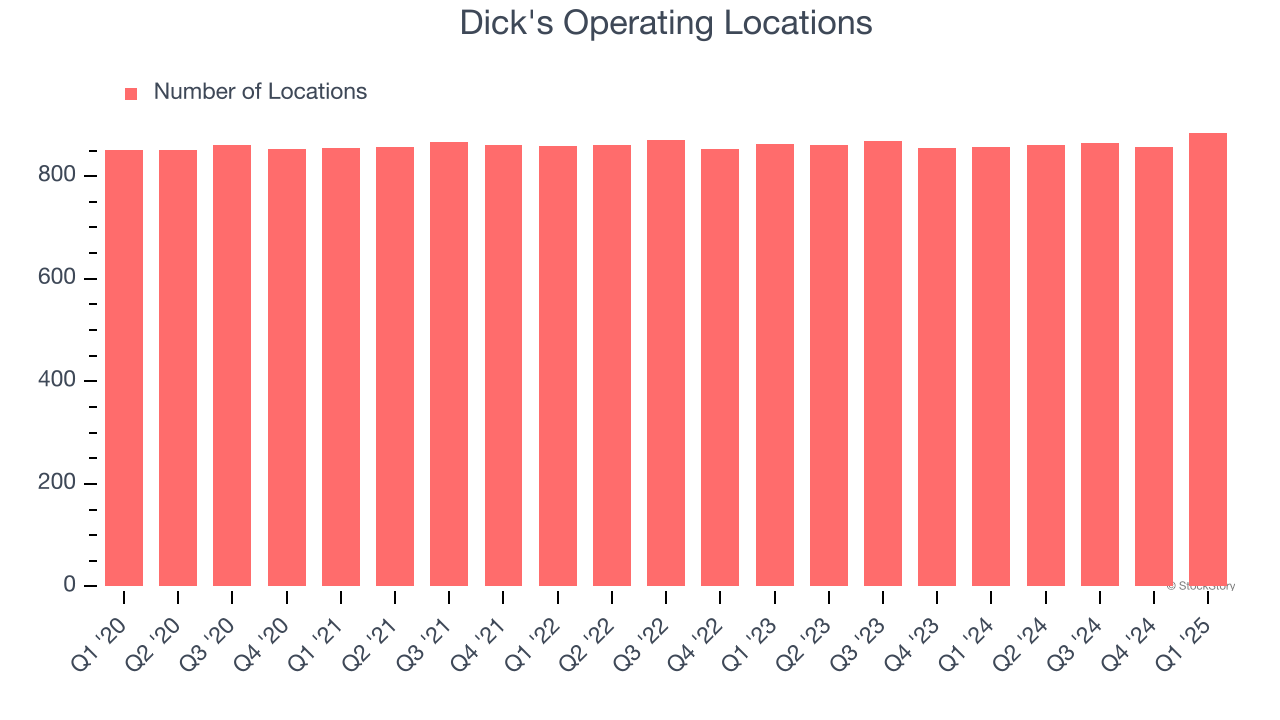
Number of Stores
Dick's listed 885 locations in the latest quarter and has kept its store count flat over the last two years while other consumer retail businesses have opted for growth.
When a retailer keeps its store footprint steady, it usually means demand is stable and it’s focusing on operational efficiency to increase profitability.
Same-Store Sales
The change in a company's store base only tells one side of the story. The other is the performance of its existing locations and e-commerce sales, which informs management teams whether they should expand or downsize their physical footprints. Same-store sales gives us insight into this topic because it measures organic growth for a retailer's e-commerce platform and brick-and-mortar shops that have existed for at least a year.
Dick’s demand has been spectacular for a retailer over the last two years. On average, the company has increased its same-store sales by an impressive 4% per year. Given its flat store base over the same period, this performance stems from not only increased foot traffic at existing locations but also higher e-commerce sales as demand shifts from in-store to online.
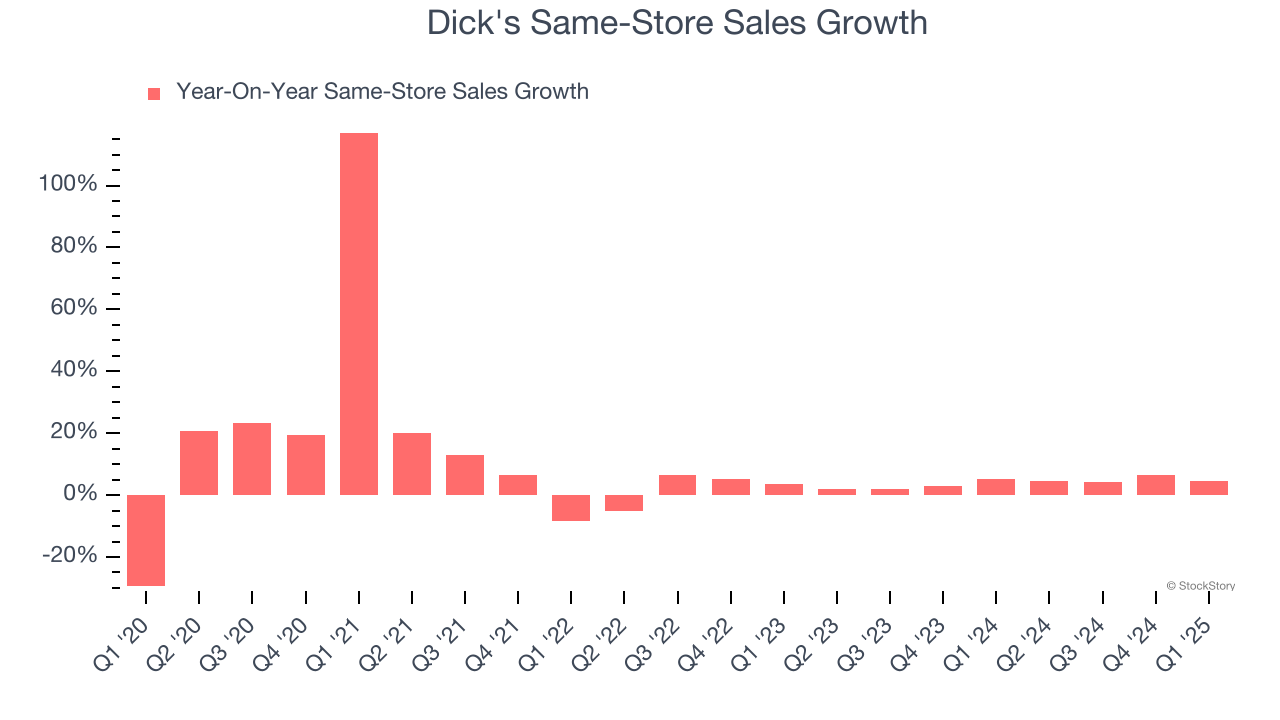
In the latest quarter, Dick’s same-store sales rose 4.5% year on year. This performance was more or less in line with its historical levels.
Key Takeaways from Dick’s Q1 Results
We liked that Dick's revenue and EPS narrowly outperformed Wall Street’s estimates. On the other hand, its full-year EPS guidance missed and its gross margin fell slightly short of Wall Street’s estimates. Overall, this print was mixed. The stock remained flat at $172.50 immediately following the results.
Should you buy the stock or not? The latest quarter does matter, but not nearly as much as longer-term fundamentals and valuation, when deciding if the stock is a buy. We cover that in our actionable full research report which you can read here, it’s free.