Personal computing and printing company HP (NYSE: HPQ) announced better-than-expected revenue in Q1 CY2025, with sales up 3.3% year on year to $13.22 billion. Its non-GAAP profit of $0.71 per share was 11.6% below analysts’ consensus estimates.
Is now the time to buy HP? Find out by accessing our full research report, it’s free.
HP (HPQ) Q1 CY2025 Highlights:
- Revenue: $13.22 billion vs analyst estimates of $13.1 billion (3.3% year-on-year growth, 0.9% beat)
- Adjusted EPS: $0.71 vs analyst expectations of $0.80 (11.6% miss)
- Adjusted EBITDA: $999 million vs analyst estimates of $1.21 billion (7.6% margin, 17.4% miss)
- Management lowered its full-year Adjusted EPS guidance to $3.15 at the midpoint, a 12.5% decrease
- Operating Margin: 4.9%, down from 7.4% in the same quarter last year
- Free Cash Flow was -$145 million, down from $462 million in the same quarter last year
- Market Capitalization: $26.72 billion
“In Q2, we delivered solid revenue growth, led by strong Commercial performance in Personal Systems and continued momentum behind our future of work strategy,” said Enrique Lores, President and CEO.
Company Overview
Born from the legendary Silicon Valley garage startup founded by Bill Hewlett and Dave Packard in 1939, HP (NYSE: HPQ) designs and sells personal computers, printers, and related technology products and services to consumers, businesses, and enterprises worldwide.
Sales Growth
A company’s long-term sales performance can indicate its overall quality. Any business can put up a good quarter or two, but many enduring ones grow for years.
With $54.3 billion in revenue over the past 12 months, HP is a behemoth in the business services sector and benefits from economies of scale, giving it an edge in distribution. This also enables it to gain more leverage on its fixed costs than smaller competitors and the flexibility to offer lower prices. However, its scale is a double-edged sword because finding new avenues for growth becomes difficult when you already have a substantial market presence. For HP to boost its sales, it likely needs to adjust its prices, launch new offerings, or lean into foreign markets.
As you can see below, HP’s revenue declined by 1% per year over the last five years, a tough starting point for our analysis.
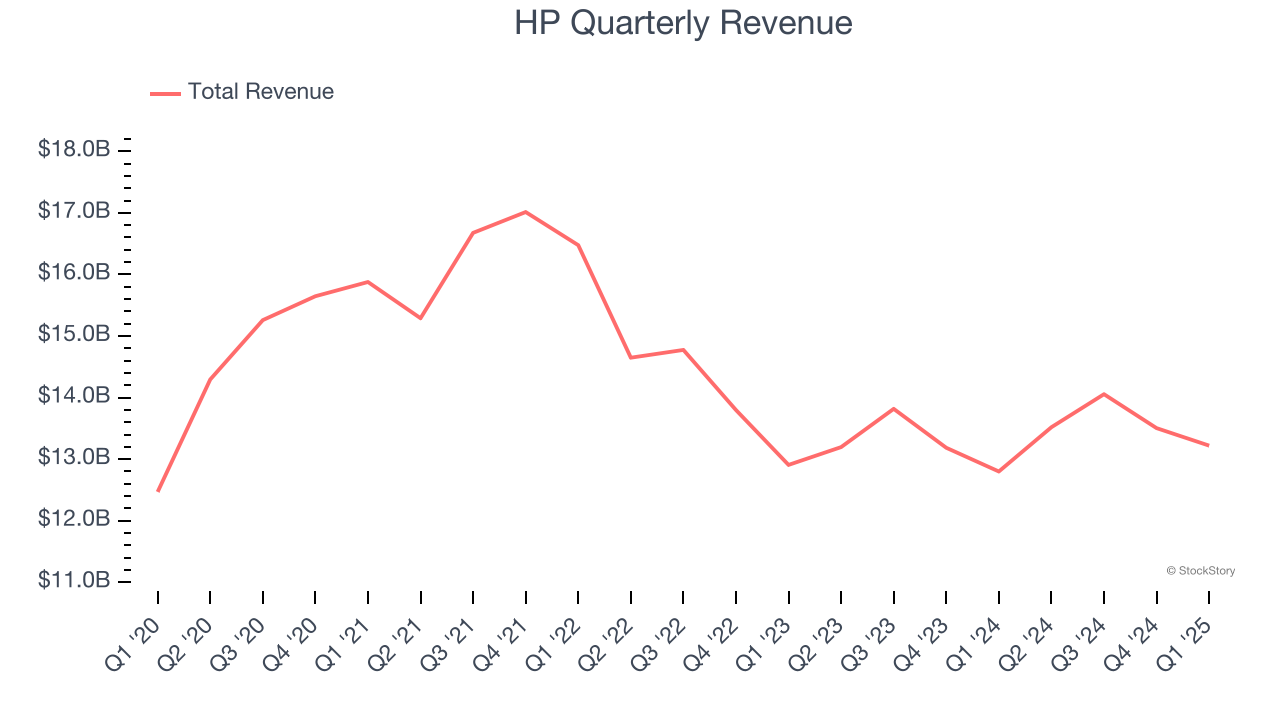
Long-term growth is the most important, but within business services, a half-decade historical view may miss new innovations or demand cycles. HP’s annualized revenue declines of 1.6% over the last two years align with its five-year trend, suggesting its demand has consistently shrunk. 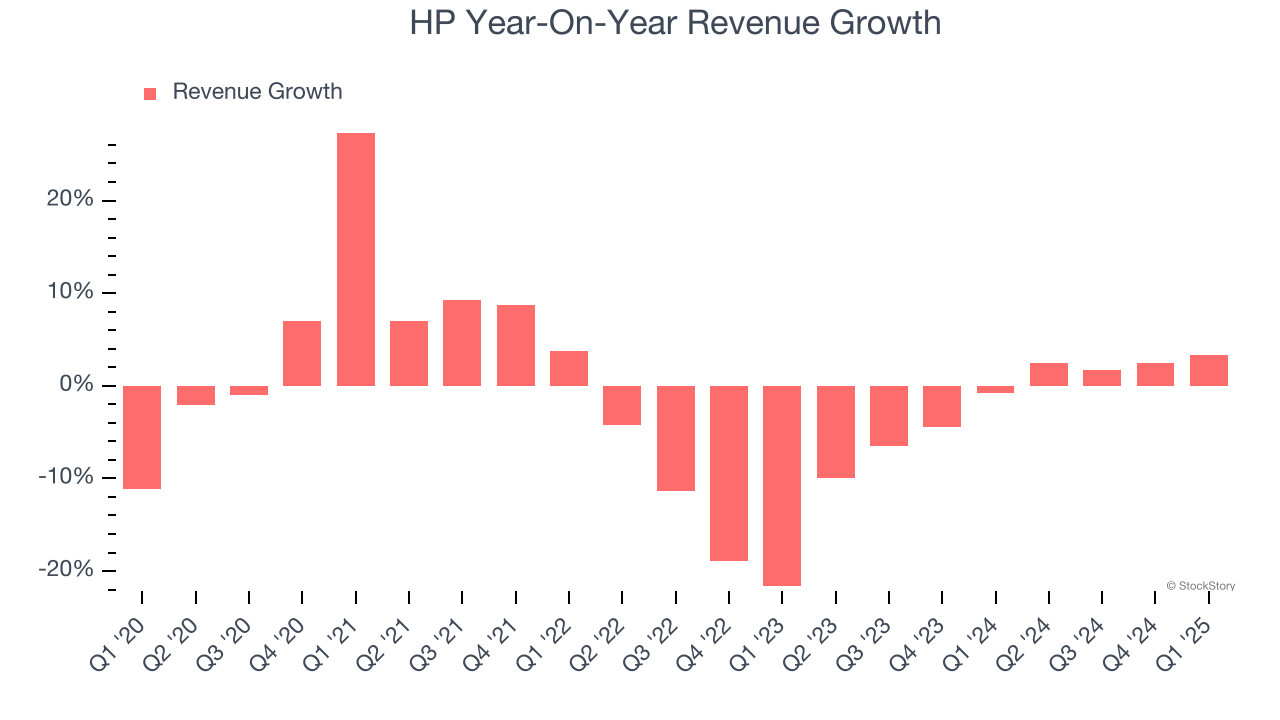
We can better understand the company’s revenue dynamics by analyzing its most important segments, Commercial Personal Systems and Commercial Printing, which are 51.3% and 31.6% of revenue. Over the last two years, HP’s Commercial Personal Systems revenue (desktops, laptops, etc.) averaged 1.1% year-on-year growth. On the other hand, its Commercial Printing revenue (commercial or industrial printers) averaged 3.9% declines.
This quarter, HP reported modest year-on-year revenue growth of 3.3% but beat Wall Street’s estimates by 0.9%.
Looking ahead, sell-side analysts expect revenue to grow 1.4% over the next 12 months. While this projection implies its newer products and services will spur better top-line performance, it is still below the sector average.
Today’s young investors won’t have read the timeless lessons in Gorilla Game: Picking Winners In High Technology because it was written more than 20 years ago when Microsoft and Apple were first establishing their supremacy. But if we apply the same principles, then enterprise software stocks leveraging their own generative AI capabilities may well be the Gorillas of the future. So, in that spirit, we are excited to present our Special Free Report on a profitable, fast-growing enterprise software stock that is already riding the automation wave and looking to catch the generative AI next.
Operating Margin
Operating margin is one of the best measures of profitability because it tells us how much money a company takes home after subtracting all core expenses, like marketing and R&D.
HP was profitable over the last five years but held back by its large cost base. Its average operating margin of 7% was weak for a business services business.
Analyzing the trend in its profitability, HP’s operating margin might fluctuated slightly but has generally stayed the same over the last five years, which doesn’t help its cause.
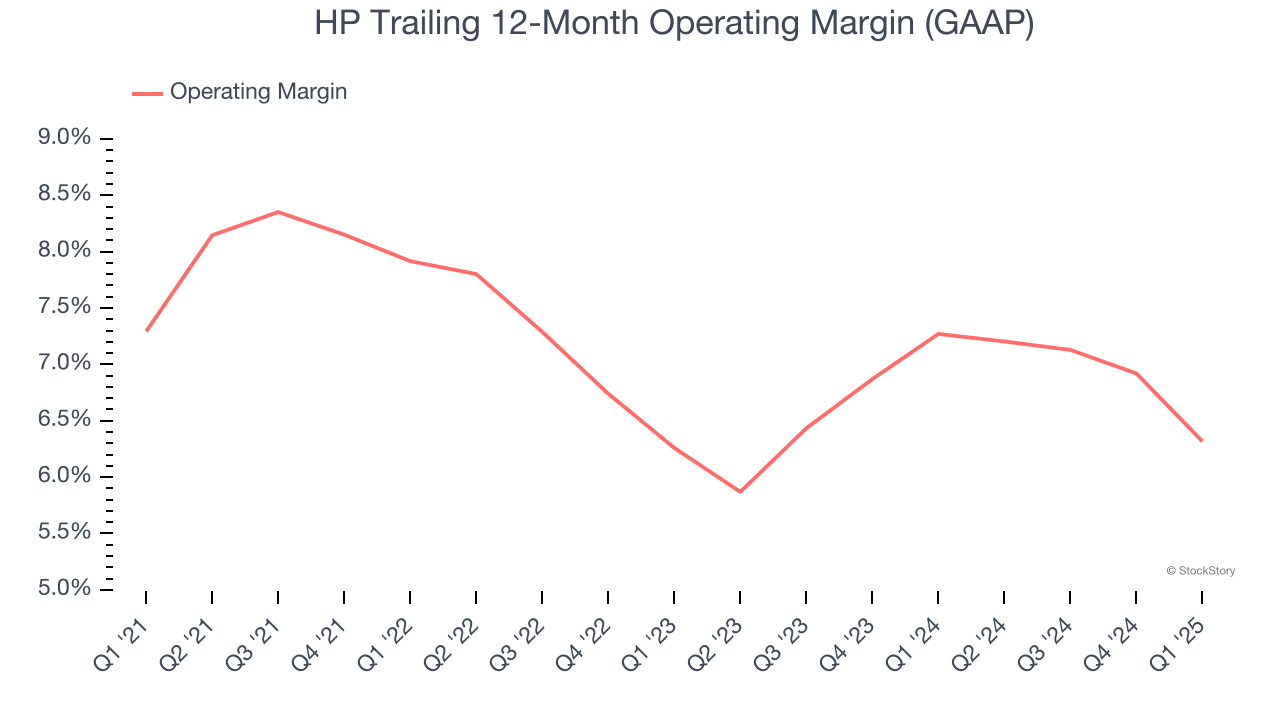
In Q1, HP generated an operating profit margin of 4.9%, down 2.5 percentage points year on year. This contraction shows it was less efficient because its expenses grew faster than its revenue.
Earnings Per Share
We track the long-term change in earnings per share (EPS) for the same reason as long-term revenue growth. Compared to revenue, however, EPS highlights whether a company’s growth is profitable.
HP’s EPS grew at an unimpressive 6.5% compounded annual growth rate over the last five years. This performance was better than its 1% annualized revenue declines but doesn’t tell us much about its business quality because its operating margin didn’t expand.
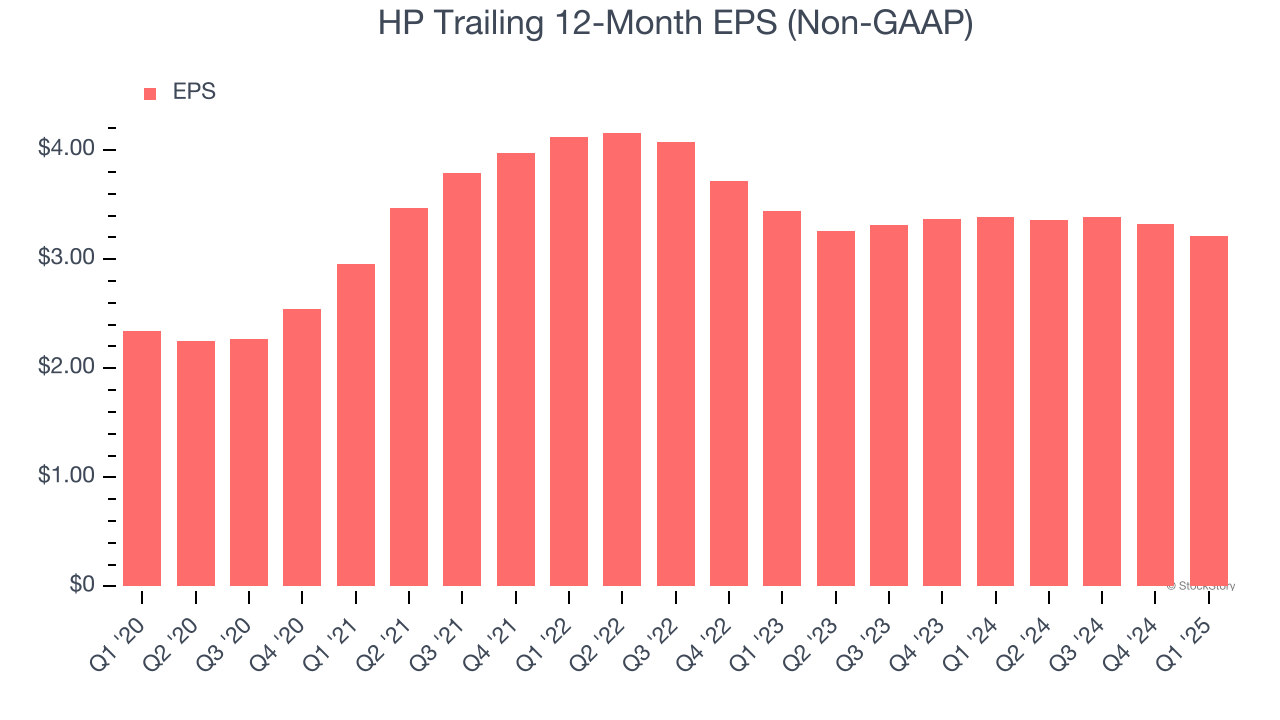
We can take a deeper look into HP’s earnings to better understand the drivers of its performance. A five-year view shows that HP has repurchased its stock, shrinking its share count by 33.6%. This tells us its EPS outperformed its revenue not because of increased operational efficiency but financial engineering, as buybacks boost per share earnings. 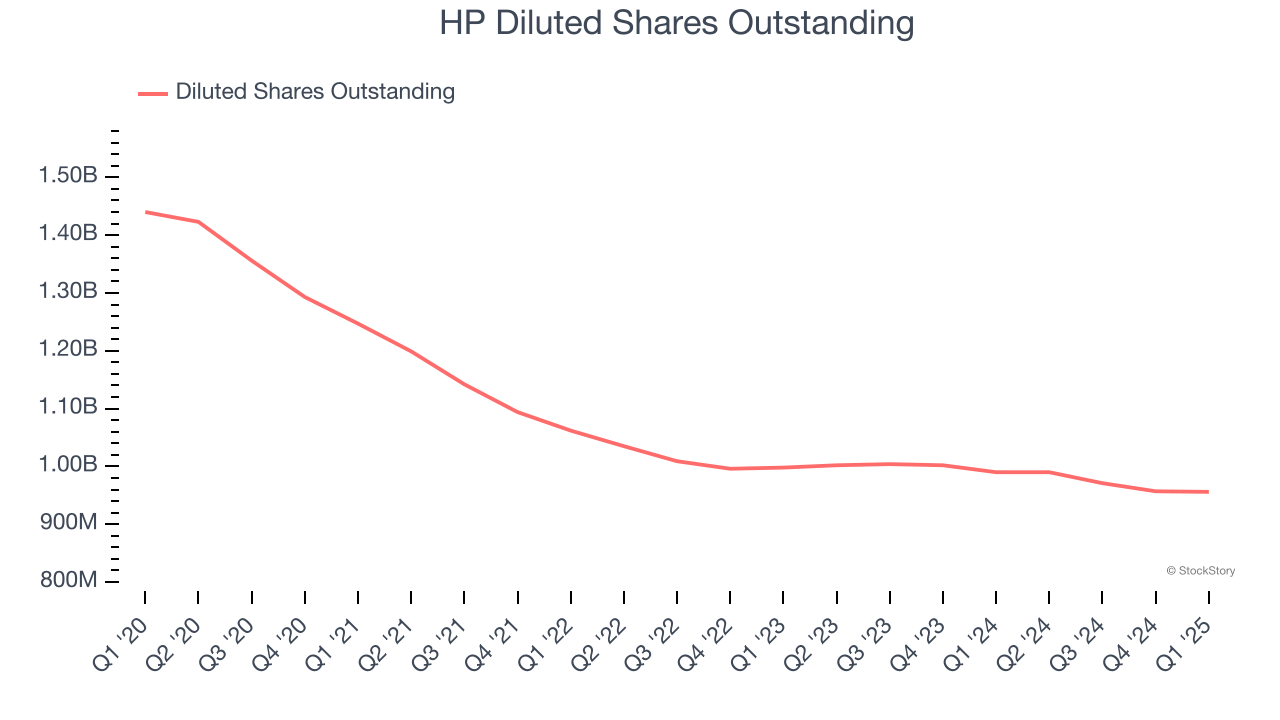
In Q1, HP reported EPS at $0.71, down from $0.82 in the same quarter last year. This print missed analysts’ estimates. Over the next 12 months, Wall Street expects HP’s full-year EPS of $3.21 to grow 12.9%.
Key Takeaways from HP’s Q1 Results
It was good to see HP narrowly top analysts’ revenue expectations this quarter. On the other hand, its EPS and EBITDA missed, and it lowered its full-year EPS guidance. Overall, this was a softer quarter. The stock traded down 16.3% to $22.85 immediately after reporting.
HP didn’t show it’s best hand this quarter, but does that create an opportunity to buy the stock right now? We think that the latest quarter is only one piece of the longer-term business quality puzzle. Quality, when combined with valuation, can help determine if the stock is a buy. We cover that in our actionable full research report which you can read here, it’s free.