Leading designer of graphics chips Nvidia (NASDAQ: NVDA) reported Q1 CY2025 results exceeding the market’s revenue expectations, with sales up 69.2% year on year to $44.06 billion. On the other hand, next quarter’s revenue guidance of $45 billion was less impressive, coming in 1.6% below analysts’ estimates. Its non-GAAP profit of $0.81 per share was 8% above analysts’ consensus estimates.
Is now the time to buy Nvidia? Find out by accessing our full research report, it’s free.
Nvidia (NVDA) Q1 CY2025 Highlights:
- Revenue: $44.06 billion vs analyst estimates of $43.28 billion (69.2% year-on-year growth, 1.8% beat)
- Datacenter Revenue: $39.1 billion vs analyst estimates of $39.2 billion (73% year-on-year growth, slight miss)
- Adjusted EPS: $0.81 vs analyst estimates of $0.75 (8% beat)
- Adjusted Operating Income: $23.28 billion vs analyst estimates of $22.04 billion (52.8% margin, 5.6% beat)
- Revenue Guidance for Q2 CY2025 is $45 billion at the midpoint, below analyst estimates of $45.75 billion
- Operating Margin: 49.1%, down from 64.9% in the same quarter last year
- Free Cash Flow Margin: 59.3%, up from 57.5% in the same quarter last year
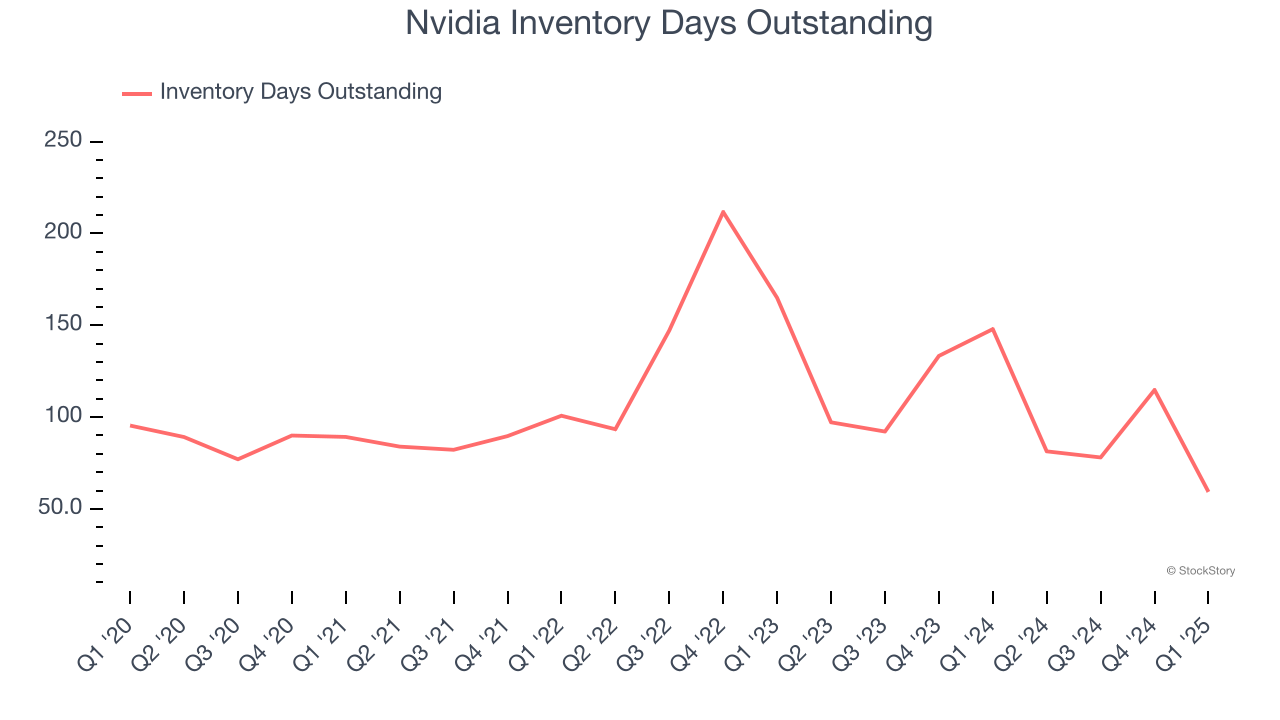
- Inventory Days Outstanding: 59, down from 115 in the previous quarter
- Market Capitalization: $3.30 trillion
“Our breakthrough Blackwell NVL72 AI supercomputer — a ‘thinking machine’ designed for reasoning— is now in full-scale production across system makers and cloud service providers,” said Jensen Huang, founder and CEO of NVIDIA.
Company Overview
Founded in 1993 by Jensen Huang and two former Sun Microsystems engineers, Nvidia (NASDAQ: NVDA) is a leading fabless designer of chips used in gaming, PCs, data centers, automotive, and a variety of end markets.
Sales Growth
Examining a company’s long-term performance can provide clues about its quality. Any business can experience short-term success, but top-performing ones enjoy sustained growth for years. Thankfully, Nvidia’s 66% annualized revenue growth over the last five years was incredible. Its growth surpassed the average semiconductor company and shows its offerings resonate with customers, a great starting point for our analysis. Semiconductors are a cyclical industry, and long-term investors should be prepared for periods of high growth followed by periods of revenue contractions (which can sometimes offer opportune times to buy).
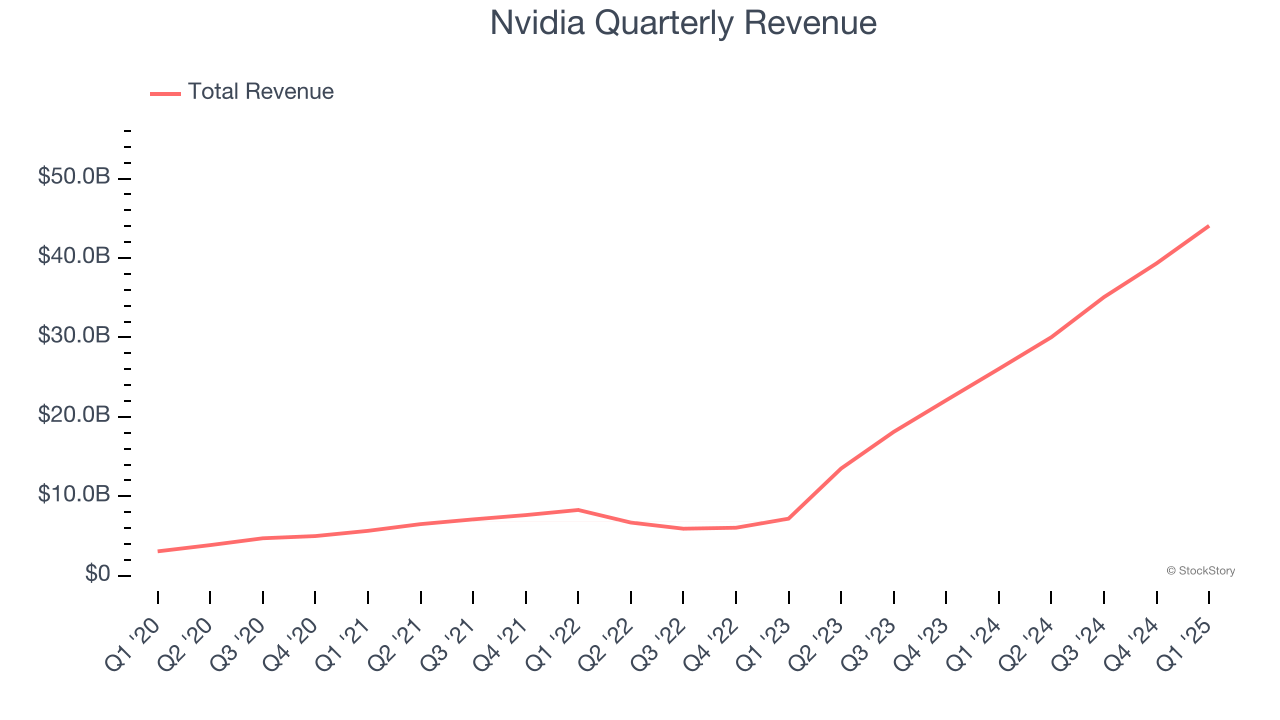
Long-term growth is the most important, but short-term results matter for semiconductors because the rapid pace of technological innovation (Moore's Law) could make yesterday's hit product obsolete today. Nvidia’s annualized revenue growth of 140% over the last two years is above its five-year trend, suggesting its demand was strong and recently accelerated. 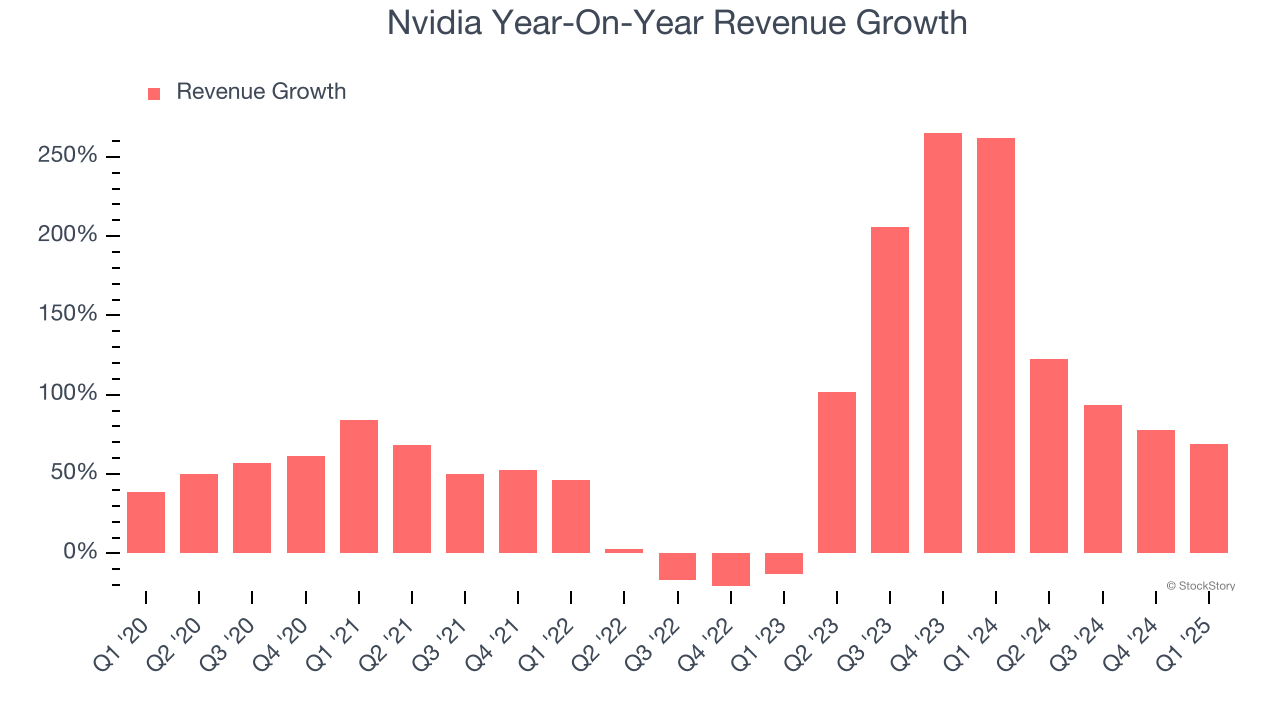
This quarter, Nvidia reported magnificent year-on-year revenue growth of 69.2%, and its $44.06 billion of revenue beat Wall Street’s estimates by 1.8%. Despite the beat, this was its third consecutive quarter of decelerating growth, indicating that the current upcycle is potentially losing some steam. Company management is currently guiding for a 49.8% year-on-year increase in sales next quarter.
Looking further ahead, sell-side analysts expect revenue to grow 43% over the next 12 months, a deceleration versus the last two years. Still, this projection is eye-popping given its scale and indicates the market is baking in success for its products and services.
Today’s young investors won’t have read the timeless lessons in Gorilla Game: Picking Winners In High Technology because it was written more than 20 years ago when Microsoft and Apple were first establishing their supremacy. But if we apply the same principles, then enterprise software stocks leveraging their own generative AI capabilities may well be the Gorillas of the future. So, in that spirit, we are excited to present our Special Free Report on a profitable, fast-growing enterprise software stock that is already riding the automation wave and looking to catch the generative AI next.
Product Demand & Outstanding Inventory
Days Inventory Outstanding (DIO) is an important metric for chipmakers, as it reflects a business’ capital intensity and the cyclical nature of semiconductor supply and demand. In a tight supply environment, inventories tend to be stable, allowing chipmakers to exert pricing power. Steadily increasing DIO can be a warning sign that demand is weak, and if inventories continue to rise, the company may have to downsize production.
This quarter, Nvidia’s DIO came in at 59, which is 47 days below its five-year average. At the moment, these numbers show no indication of an excessive inventory buildup.
Key Takeaways from Nvidia’s Q1 Results
We were impressed by Nvidia’s strong improvement in inventory levels. We were also excited its revenue, operating income, and EPS outperformed Wall Street’s estimates. It wasn't a perfect quarter, though. The company's Datacenter revenue missed by a slight amount, and its revenue guidance for next quarter missed. Overall, we think this was a decent quarter with some key metrics above expectations. The stock traded up 2.8% to $138.56 immediately after reporting.
Nvidia may have had a good quarter, but does that mean you should invest right now? If you’re making that decision, you should consider the bigger picture of valuation, business qualities, as well as the latest earnings. We cover that in our actionable full research report which you can read here, it’s free.